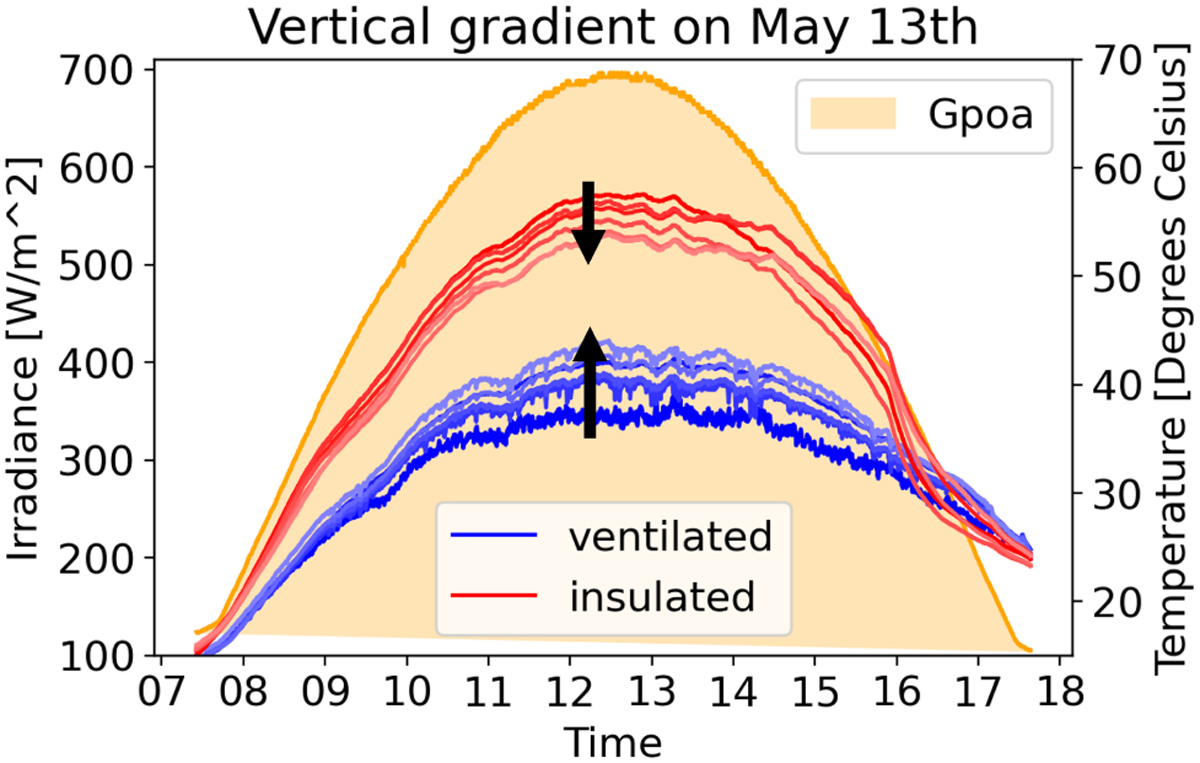
Fig. 10
Download original image
Example day of May 13th, 2023 – showing data from the 3 cm column (insulated) plus the 20 cm column (rear-ventilated). Showing the temperature development on a clear-sky day for sensors installed at different heights. The lighter the color of the graph, the higher the sensor placement. Arrows point from the lowest-placed sensor to the highest-placed sensor for each mounting configuration.
Current usage metrics show cumulative count of Article Views (full-text article views including HTML views, PDF and ePub downloads, according to the available data) and Abstracts Views on Vision4Press platform.
Data correspond to usage on the plateform after 2015. The current usage metrics is available 48-96 hours after online publication and is updated daily on week days.
Initial download of the metrics may take a while.