Fig. 6
Download original image
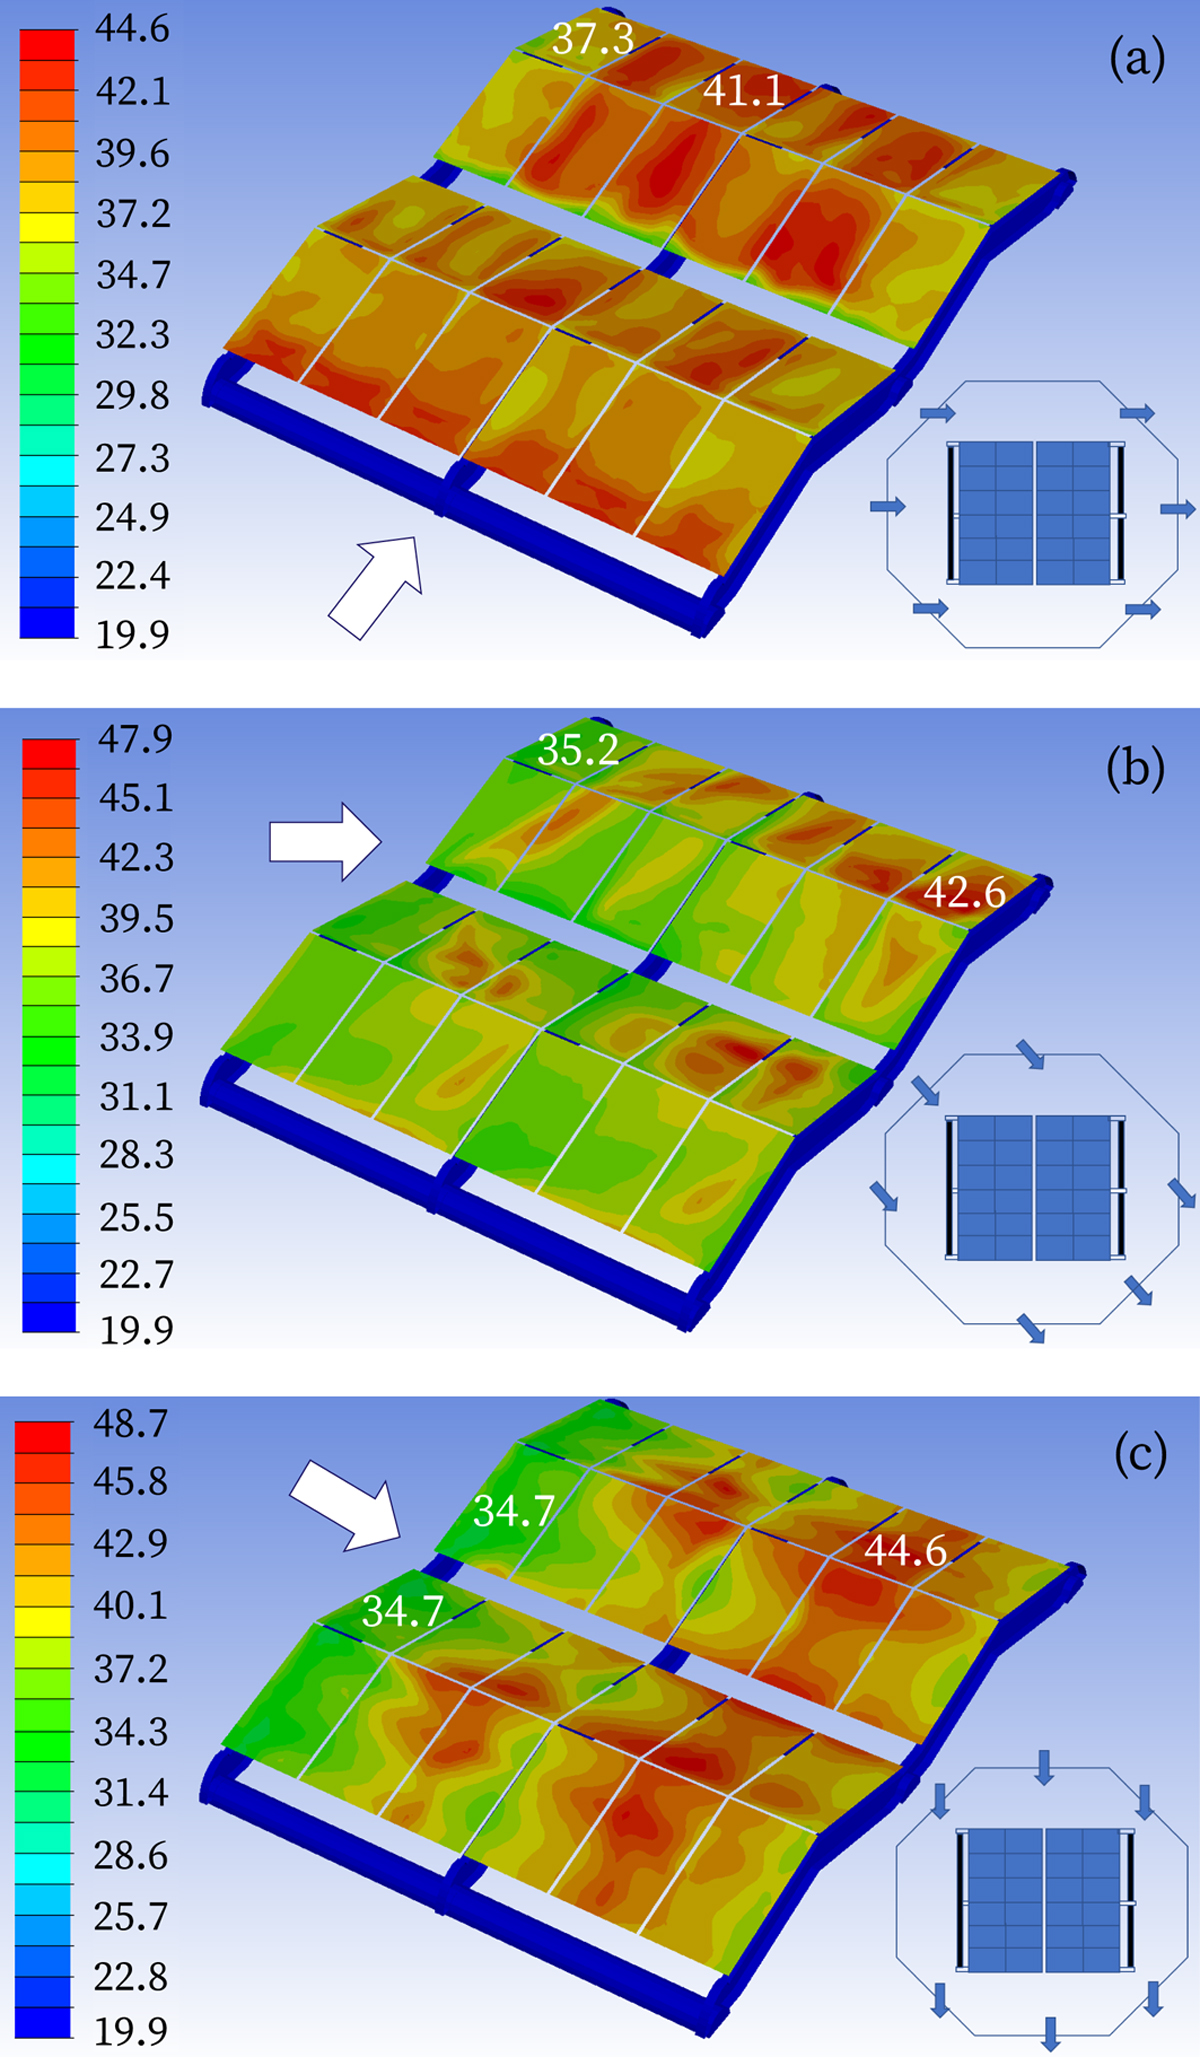
Cell temperatures computed from CFD modelling based on a wind speed of 3 m/s. Average cell temperatures for each module in the system were computed and the minimum and maximum average cell temperatures are shown by white-colored values on the associated modules. (a) Wind from the front. (b) Wind from the diagonal. (c) Wind from the side.
Current usage metrics show cumulative count of Article Views (full-text article views including HTML views, PDF and ePub downloads, according to the available data) and Abstracts Views on Vision4Press platform.
Data correspond to usage on the plateform after 2015. The current usage metrics is available 48-96 hours after online publication and is updated daily on week days.
Initial download of the metrics may take a while.