Open Access
Fig. 4
Download original image
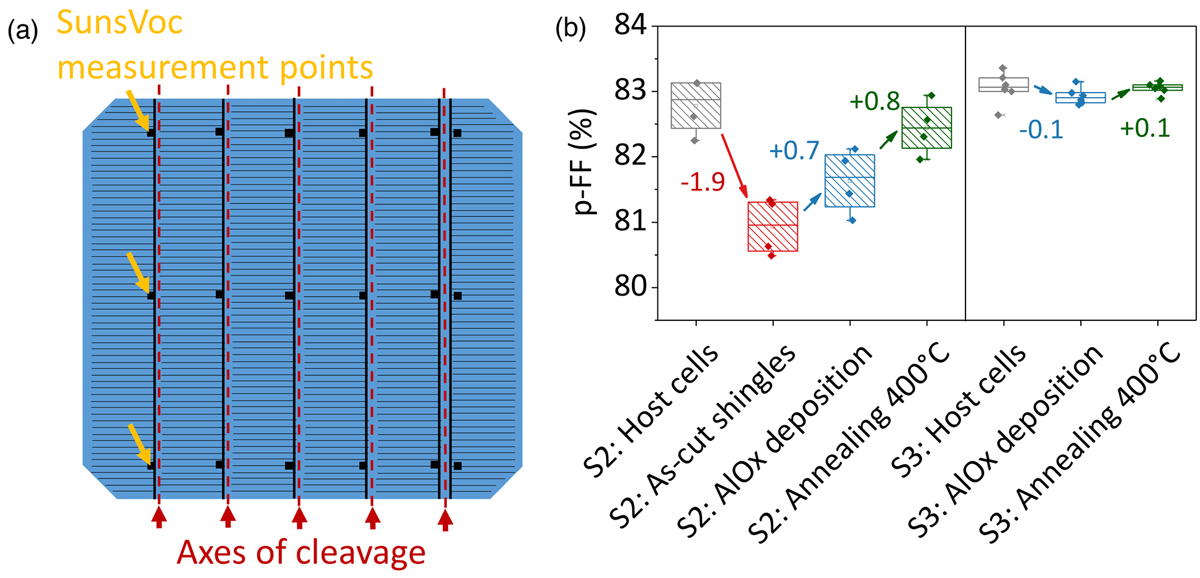
(a) Schematic position of separation axes and example of contacting points on the left shingle during Suns VOC measurements. (b) p-FF evolution for S2 and S3 groups.
Current usage metrics show cumulative count of Article Views (full-text article views including HTML views, PDF and ePub downloads, according to the available data) and Abstracts Views on Vision4Press platform.
Data correspond to usage on the plateform after 2015. The current usage metrics is available 48-96 hours after online publication and is updated daily on week days.
Initial download of the metrics may take a while.