Fig. 1

Download original image
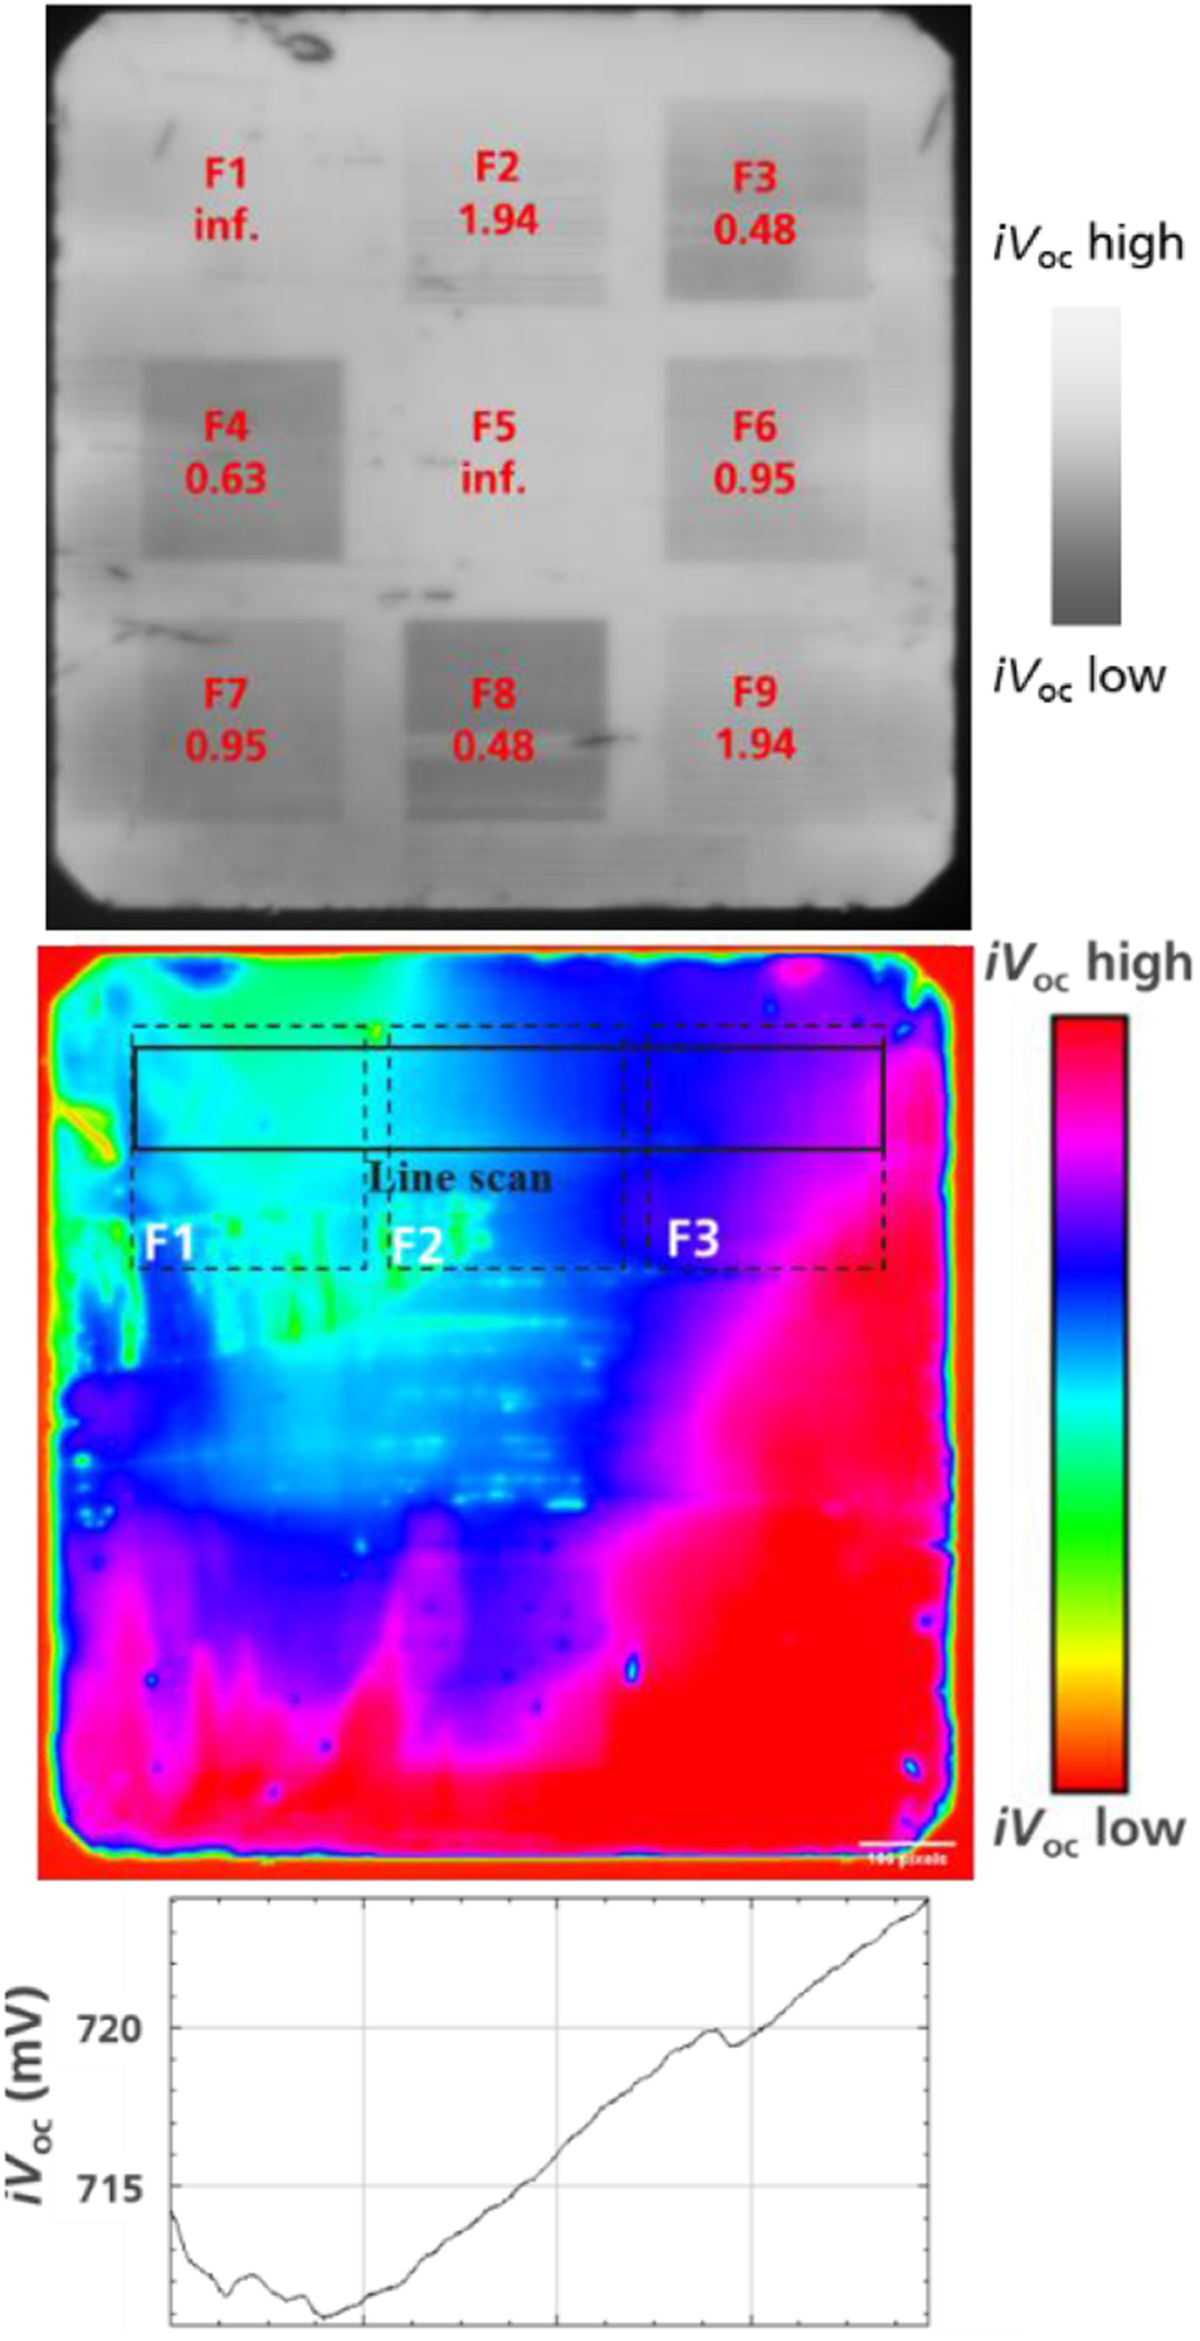
TOP: A PL image of a over fired wafer, indicating nine individual fields F1-F9 with varying Finger pitches in “mm”. On the edges TLM structures are located. Middle: An implied iVoc Mod-PL image of a selected sample showing no field pattern, but other significant inhomogeneities. The iVoc as a result from the indicated line scan area is shown in the bottom graph.
Current usage metrics show cumulative count of Article Views (full-text article views including HTML views, PDF and ePub downloads, according to the available data) and Abstracts Views on Vision4Press platform.
Data correspond to usage on the plateform after 2015. The current usage metrics is available 48-96 hours after online publication and is updated daily on week days.
Initial download of the metrics may take a while.


