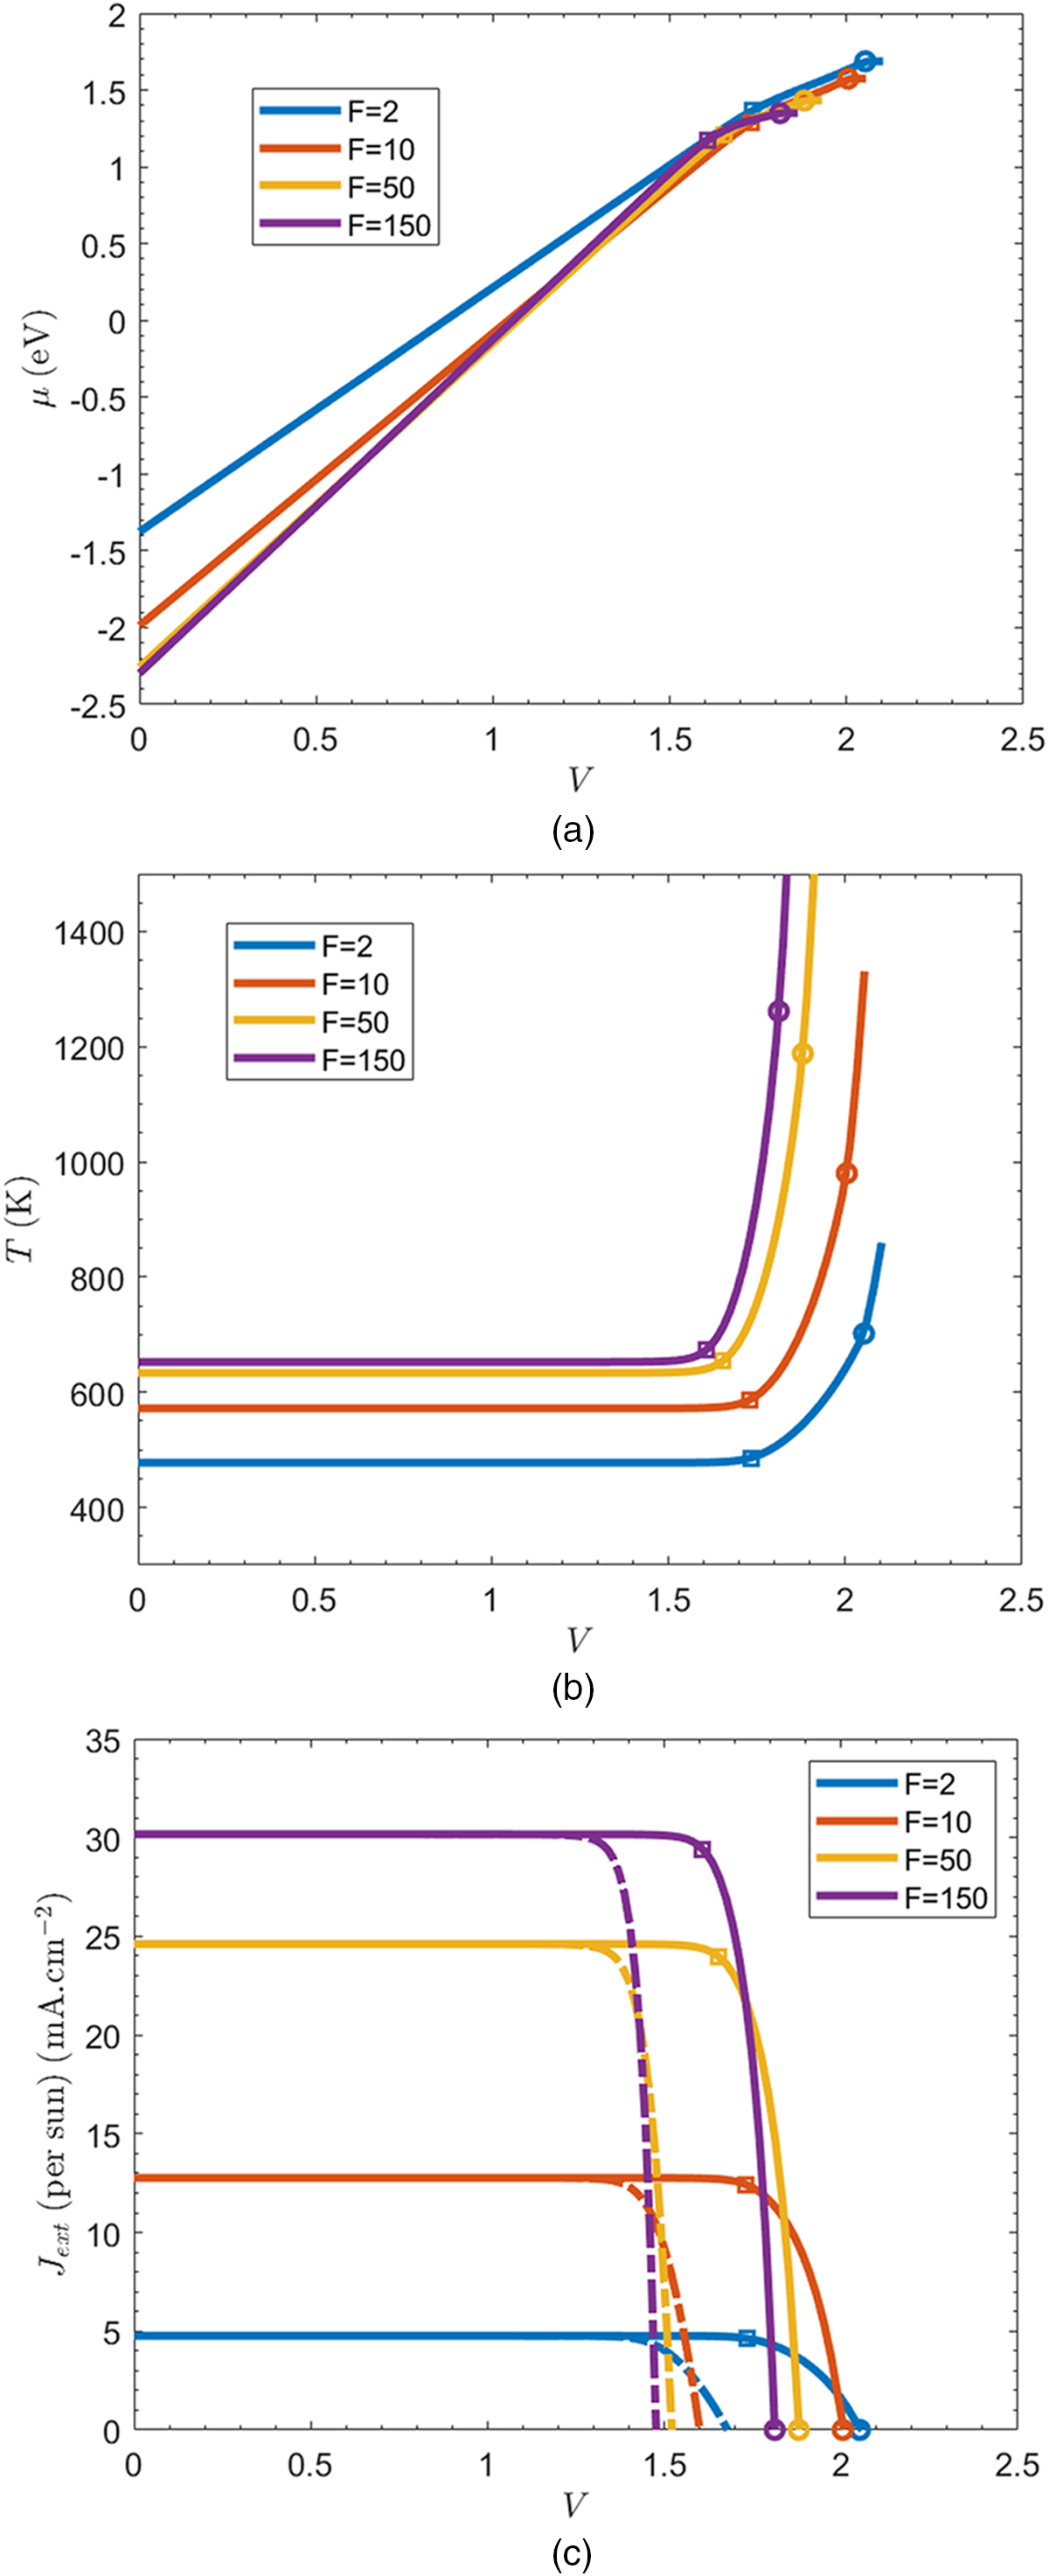
Fig. 4
Download original image
(a) Chemical potential, (b) temperature of the carriers, and (c) extracted current (per sun) of a conventional cell and an HCSC, in dashed and continuous line, respectively, as a function of the applied voltage. The squares and circles respectively indicate the maximum power point and open circuit of the HCSC. These results are obtained for Q = 1 W cm−2 K−1.
Current usage metrics show cumulative count of Article Views (full-text article views including HTML views, PDF and ePub downloads, according to the available data) and Abstracts Views on Vision4Press platform.
Data correspond to usage on the plateform after 2015. The current usage metrics is available 48-96 hours after online publication and is updated daily on week days.
Initial download of the metrics may take a while.