Open Access
Fig. 6
Download original image
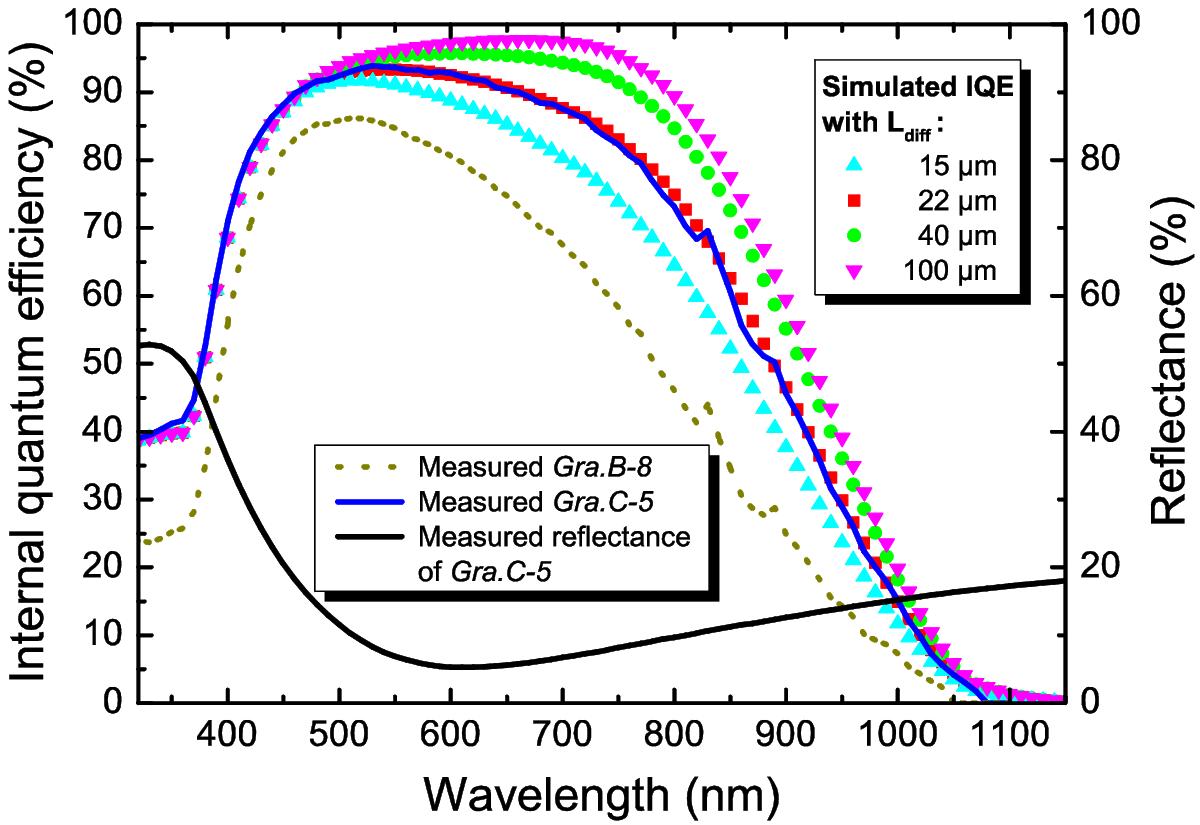
The reflectance, measured and simulated IQE curves of the cell Gra. C-5. The measured IQE of the cell Gra. B-8 is plotted for comparison. The bulk lifetime was varied for fitting. The IQE is simulated by PC1D for diffusion lengths with 15, 22, 40, and 100 μm.
Current usage metrics show cumulative count of Article Views (full-text article views including HTML views, PDF and ePub downloads, according to the available data) and Abstracts Views on Vision4Press platform.
Data correspond to usage on the plateform after 2015. The current usage metrics is available 48-96 hours after online publication and is updated daily on week days.
Initial download of the metrics may take a while.