Fig. 9
Download original image
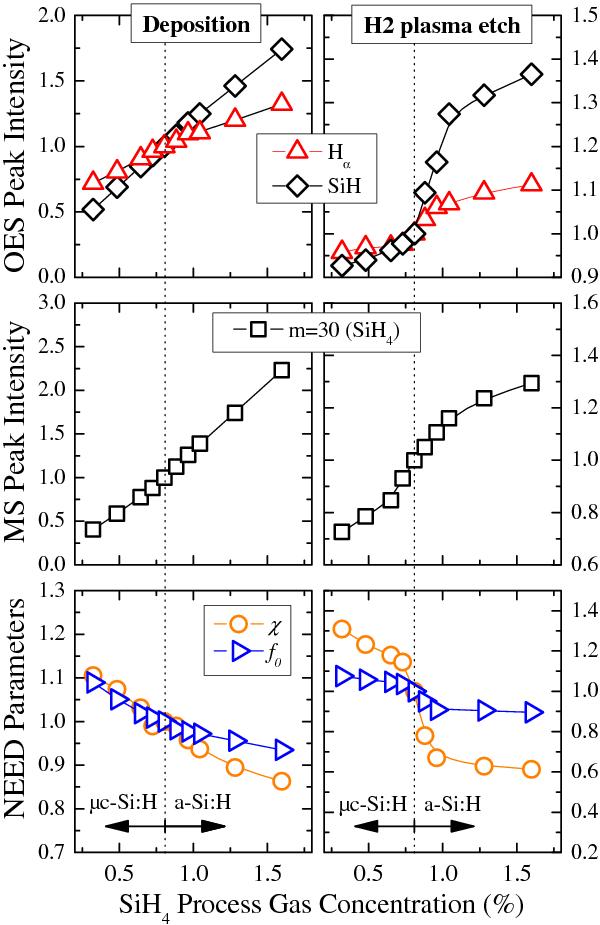
OES, MS and NEED data measured during μc-Si:H deposition (left) and subsequent H2 plasma etching (right). The μc-Si:H ↔ a-Si:H phase transition is indicated with a dotted line at 0.81% and all curves are normalized to their values at 0.81%.
Current usage metrics show cumulative count of Article Views (full-text article views including HTML views, PDF and ePub downloads, according to the available data) and Abstracts Views on Vision4Press platform.
Data correspond to usage on the plateform after 2015. The current usage metrics is available 48-96 hours after online publication and is updated daily on week days.
Initial download of the metrics may take a while.