| Issue |
EPJ Photovolt.
Volume 2, 2011
|
|
|---|---|---|
| Article Number | 20801 | |
| Number of page(s) | 10 | |
| Section | Deployment | |
| DOI | https://doi.org/10.1051/epjpv/2011005 | |
| Published online | 29 September 2011 | |
https://doi.org/10.1051/epjpv/2011005
Quo Vadis photovoltaics 2011
European Commission, Joint Research Centre; Renewable Energy Unit, via E. Fermi 2749, TP 450, 21027 Ispra ( VA), Italy
a
e-mail: This email address is being protected from spambots. You need JavaScript enabled to view it.
Received: 31 May 2011
Accepted: 12 July 2011
Published online:
29
September
2011
Abstract
Since more than 10 years photovoltaics is one of the most dynamic industries with growth rates well beyond 40% per annum. This growth is driven not only by the progress in materials knowledge and processing technology, but also by market introduction programmes in many countries around the world. Despite the negative impacts on the economy by the financial crisis since 2009, photovoltaics is still growing at an extraordinary pace and had in 2010 an extraordinary success, as both production and markets doubled. The open question is what will happen in 2011 and the years after as the situation is dominated by huge manufacturing overcapacities and an increasing unpredictability of policy support. How can the PV industry continue their cost reduction to ensure another 10 to 20 years of sustained and strong growth necessary to make PV to one of the main pillars of a sustainable energy supply in 2030. Despite the fact, that globally the share of electricity from photovoltaic systems is still small, at local level it can be already now above 30% of the demand at certain times of the year. Future research in PV has to provide intelligent solutions not only on the solar cell alone, but also on the module and the system integration level in order to permit a 5 to 10% share of electricity in 2020.
© EDP Sciences 2011
 This is an Open Access article distributed under the terms of the Creative Commons Attribution-Noncommercial License 3.0, which permits
unrestricted use, distribution, and reproduction in any noncommercial medium, provided the original work is properly cited.
This is an Open Access article distributed under the terms of the Creative Commons Attribution-Noncommercial License 3.0, which permits
unrestricted use, distribution, and reproduction in any noncommercial medium, provided the original work is properly cited.
1 Introduction
Production data for the global cell production1 in 2010 vary between 18 GW and 27 GW. The significant uncertainty in the data for 2010 is due to the very competitive market environment, as well as the fact that some companies report shipment figures, others report sales and again other report production figures. In addition, the difficult economic conditions and increased competition led to a decreased willingness to report confidential company data. The previous tight silicon supply situation reversed due to massive production expansions as well as the economic situation. This led to a price decrease from the 2008 peak of around 500 $/kg to about 50−55 $/kg at the end of 2009 with a slight upwards tendency throughout 2010 and early 2011.
The presented data, collected from various companies and colleagues were compared to various data sources and thus led to an estimate of 23.5 GW (Fig. 1), representing a doubling of production compared to 2009.
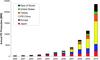 |
Fig. 1 World PV Cell/Module Production from 2000 to 2010 (data source: Navigant [2], Photon Magazine [3], PV News [4] and own analysis). |
Since 2000, total PV production increased almost by two orders of magnitude, with annual growth rates between 40% and 80%. The most rapid growth in annual production over the last five years could be observed in Asia, where China and Taiwan together now account for more than 50% of world-wide production.
The change of the market from a supply restricted – to a demand-driven market and the resulting overcapacity for solar modules has resulted in a dramatic price reduction of more than 50% over the last three years. Especially companies in their start-up and expansion phase with limited financial resources and restricted access to capital are struggling in the current market environment. This situation is believed to continue for at least the next few years and put further pressure on the reduction of the average selling prices (ASP). The recent financial crisis added pressure as it resulted in higher government bond yields and ASPs have to decline even faster than previously expected to allow for higher project internal rate of returns (IRRs). On the other hand, the rapid declining module and system prices open new markets, which offer the perspectives for further growth of the industry – at least for those companies with the capability to expand and reduce their costs at the same pace.
For the third year in a row solar power attracted behind wind the second largest amount of new investments into renewable energies [1]. Business analysts are confident that the industry fundamentals as a whole remain strong and that the overall photovoltaics sector will continue to experience a significant long-term growth. Following the stock market decline, as a result of the financial turmoil, the PPVX2 (Photon Pholtovoltaic Stock Index) declined from its high at over 6500 points at the beginning of 2008 to 2095 points at the end of 2008. At the beginning of April 2011 the index stood at 2571 points and the market capitalisation of the 30-PPVX companies3 was 43.5 billion.
Market predictions for the 2011 PV market vary between 17.3 GW by the Navigant Consulting conservative scenario [5] 19.6 GW by Macquarie [6] and 24.9 GW by iSuppli [7] with a consensus value in the 18 to 19 GW range. Massive capacity increases are underway or announced and if all of them are realised, the world-wide production capacity for solar cells would exceed 50 GW at the end of 2011. This indicates that even with the optimistic market growth expectations, the planned capacity increases are way above the market growth. The consequence would be the continuation of the low utilisation rates and therefore a continued price pressure in an oversupplied market. Such a development will accelerate the consolidation of the photovoltaics industry and spur more mergers and acquisitions.
The current solar cell technologies are well established and provide a reliable product, with sufficient efficiency and guaranteed energy output for at least 25 years of guaranteed power output. This reliability, the increasing potential of electricity interruption from grid overloads, as well as the rise of electricity prices from conventional energy sources, add to the attractiveness of Photovoltaic systems.
About 80% of the current production uses wafer-based crystalline silicon technology. A major advantage of this technology is that complete production lines can be bought, installed and be up and producing within a relatively short time-frame. This predictable production start-up scenario constitutes a low-risk placement with calculable return on investments. However, the temporary shortage in silicon feedstock and the market entry of companies offering turn-key production lines for thin-film solar cells led to a massive expansion of investments into thin-film capacities between 2005 and 2010. More than 200 companies are involved in the thin-film solar cell production process ranging from R&D activities to major manufacturing plants.
Projected silicon production capacities available for solar in 2012 vary between 140 000 metric tons from established polysilicon producers, up to 185 000 metric tons, and including the new producers up to 250 000 metric tons [8, 9]. The possible solar cell production will in addition depend on the material use per Wp. Material consumption could decrease from the current 8 g/Wp to 7 g/Wp or even 6 g/Wp, but this might not be achieved by all manufacturers.
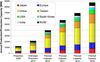 |
Fig. 2 World-wide PV Production and planned production capacity increases. |
Similar to other technology areas, new products will enter the market, enabling further cost reduction. Concentrating Photovoltaics (CPV) is an emerging market. There are two main tracks – either high concentration > 300 suns (HCPV) or low to medium concentration with a concentration factor of 2 to approx. 300. In order to maximise the benefits of CPV, the technology requires high Direct Normal Irradiation (DNI) and these areas have a limited geographical range – the “Sun Belt” of the Earth. The market share of CPV is still small, but an increasing number of companies are focusing on CPV. In 2008 about 10 MW of CPV were produced, market estimates for 2010 are in the 10 to 20 MW range and for 2011 about 50 to 100 MW are expected. In addition, dye-cells are getting ready to enter the market as well. The growth of these technologies is accelerated by the positive development of the PV market as a whole.
It can be concluded that in order to maintain the extremely high growth rate of the Photovoltaic industry, different pathways have to be pursued at the same time:
-
Continuation to expand solar grade silicon productioncapacities in line with solar cell manufacturing capacities;
-
Accelerated reduction of material consumption per silicon solar cell and Wp, e.g. higher efficiencies, thinner wafers, less wafering losses, etc.;
-
Accelerated ramp-up of thin-film solar cell manufacturing;
-
Accelerated CPV introduction into the market, as well as capacity growth rates above the normal trend.
Further photovoltaic system cost reductions will depend not only on the technology improvements and scale-up benefits in solar cell and module production, but also on the ability to decrease the system component costs, as well as the whole installation, projecting, operation, permitting and financing costs.
2 The photovoltaic industry
In 2010 the photovoltaic world market grew in terms of production by approximately 80% to 21 to 22 GW. The market for installed systems doubled again and the current estimates are between 16 and 18 GW, as reported by various consultancies. One could guess that this represents mostly the grid-connected photovoltaic market. To what extent the off-grid and consumer-product markets are included is unclear. The difference of roughly 3 to 6 GW has therefore to be explained as a combination of unaccounted off-grid installations (approx. 1 − 200 MW off-grid rural, approx. 1 − 200 MW communication/signals, approx. 100 MW off-grid commercial), consumer products (ca. 1 − 200 MW) and cells/modules in stock.
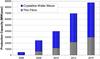 |
Fig. 3 2006 and planned PV Production capacities of Thin-Film and Crystalline Silicon based solar modules. |
In addition, the fact that some companies report shipment figures, whereas others report production figures add to the uncertainty. The difficult economic conditions added to the decreased willingness to report confidential company data. Nevertheless, the figures show a significant growth of the production as well as an increasing silicon supply situation.
The announced production capacities – based on a survey of more than 300 companies worldwide – increased despite difficult economic conditions. Despite the fact that a significant number of players announced a scale back or cancellation of their expansion plans for the time being, the number of new entrants into the field, notably large semiconductor or energy related companies overcompensated this. At least on paper the expected production capacities are increasing. Only published announcements of the respective companies and no third source info were used. The cut-off date of the used info was April 2011.
It is important to note, that production capacities are often announced, taking into account different operation models such as number of shifts, operating hours per year, etc. In addition the announcements of the increase in production capacity do not always specify when the capacity will be fully ramped up and operational. This method has of course the setback that (a) not all companies announce their capacity increases in advance and (b) that in times of financial tightening, the announcements of the scale back of expansion plans are often delayed in order not to upset financial markets. Therefore, the capacity figures just give a trend, but do not represent final numbers.
If all these ambitious plans can be realised by 2015, China will have about 38.4% of the world-wide production capacity of 88 GW, followed by Taiwan (18.0%), Europe (11.4%) and Japan ( 9.3%) (Fig. 2).
All these ambitious plans to increase production capacities at such a rapid pace depend on the expectations that markets will grow accordingly. This, however, is the biggest uncertainty as the market estimates for 2011 vary between 17 GW and 24 GW with a consensus value in the 19 GW range. In addition, most markets are still dependent on public support in the form of feed-in tariffs, investment subsidies or tax-breaks.
Already now, electricity production from photovoltaic solar systems has shown that it can be cheaper than peak prices in the electricity exchange. In the first quarter 2011, the German average price index for rooftop systems up to 100 kWp was given with 2546 per kWp without tax [10]. With such investment costs, the electricity generation costs are already at the level of residential electricity prices in some countries, depending on the actual electricity price and the local solar radiation level. But only if markets and competition will continue to grow, prices of the photovoltaic systems will continue to decrease and make electricity from PV systems for consumers even cheaper than from conventional sources. In order to achieve the price reductions and reach grid-parity for electricity generated from photovoltaic systems, public support, especially on regulatory measures, will be necessary for the next decade.
2.1 Technology Mix
Wafer-based silicon solar cells is still the main technology and had around 80% market shares in 2010. Polycrystalline solar cells still dominate the market (45 to 50%), even if the market share has slightly decreased since the beginning of the decade. Commercial module efficiencies are within a wide range between 12 and 20%, with monocrystalline modules between 14% − 20%, and polycrystalline modules between 12% − 17%. The massive manufacturing capacity increases for both technologies are followed by the necessary capacity expansions for polysilicon raw material.
In 2005, production of thin-film solar modules reached for the first time more than 100 MW per annum. Since then, the Compound Annual Growth Rate (CAGR) of thin-film solar module production was even beyond that of the overall industry, increasing the market share of thin-film products from 6% in 2005 to 10% in 2007 and 16 − 20 % in 2010.
More than 200 companies are involved in thin-film solar cell activities, ranging from basic R&D activities to major manufacturing activities and over 150 of them have announced the start or increase of production. The first 100 MW thin-film factories became operational in 2007. If all expansion plans are realised in time, thin-film production capacity could be around 22 GW, or 32% of the total 69.4 GW, in 2012 and about 30 GW, or 34%, in 2015 of a total of 87.6 GW (Fig. 3). The first thin-film factories with GW production capacity are already under construction for various thin-film technologies.
One should bear in mind that only one fourth of the over 200 companies with announced production plans have already produced thin-film modules on a commercial scale in 2010.
The majority of the companies are silicon based and use either amorphous silicon or an amorphous/microcrystalline silicon structure. 30 companies announced using Cu(In,Ga)(Se,S)2 as absorber material for their thin-film solar modules, whereas 9 companies use CdTe and 8 companies go for dye and other materials.
 |
Fig. 4 Annual photovoltaic installations from 2000 to 2010 (data source: EPIA [9], Eurobserver [11] and own analysis). |
Concentrating Photovoltaics (CPV) is an emerging technology which is growing at a very high pace, although from a low starting point. More than 50 companies are active in the field of CPV development and almost 60% of them were founded in the last five years. Over half of the companies are located either in the United States of America (primarily in California) and Europe (primarily in Spain).
Within CPV there is a differentiation according the concentration factors4 and whether the system uses a dish (Dish CPV) or lenses (lens CPV). The main parts of a CPV system are the cells, the optical elements and the tracking devices. The recent growth in CPV is based on significant improvements in all of these areas, as well as the system integration. However, it should be pointed out that CPV is just at the beginning of an industry learning curve with a considerable potential for technical and cost improvements. The most challenging task is to become cost competitive with other PV technologies quickly enough in order to use the window of opportunities for growth.
With market estimates for 2010 in the 10 to 20 MW range, the market share of CPV is still small, but already for 2011 about 50 to 100 MW are expected and there is a wide consensus amongst consultancies and market analysts that CPV will reach a GW market size by 2015.
The existing photovoltaic technology mix is a solid foundation for future growth of the sector as a whole. No single technology can satisfy all the different consumer needs, ranging from mobile and consumer applications with the need for a few watts to multi MW utility-scale power plants. The variety of technologies is an insurance against a roadblock for the implementation of solar photovoltaic electricity if material limitations or technical obstacles restrict the further growth or development of a single technology pathway.
3 The photovoltaic market
In 2010 the world-wide photovoltaic market more than doubled, driven by major increased in Europe. The current estimates are between 17 and 19 GW, as reported by various consultancies (Fig. 4). This represents mostly the grid connected photovoltaic market. To what extent the off-grid and consumer product markets are included is not clear, but it is believed that a substantial part of these markets are not accounted for as it is very difficult to track them. A conservative estimate is that they account for approx. 400 to 800 MW (approx. 1 − 200 MW off-grid rural, approx. 1 − 200 MW communication/signals, approx. 100 MW off-grid commercial and approx. 1 − 200 MW consumer products).
With a cumulative installed capacity of over 29 GW, the European Union is leading in PV installations with a little more than 70 % of the total world wide 39 GW of solar photovoltaic electricity generation capacity at the end of 2010.
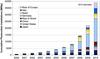 |
Fig. 5 Cumulative Photovoltaic Installations from 2000 to 2009 (data source: EPIA [9], Eurobserver [11] and own analysis). |
3.1 European Union
Market conditions for photovoltaics differ substantially from country to country. This is due to different energy policies and public support programmes for renewable energies and especially photovoltaics, as well as the varying grades of liberalisation of domestic electricity markets. After a tenfold increase of solar photovoltaic electricity generation capacity between 2001 and 2008, the newly installed capacity almost tripled in the last two years and reached 28.6 GW cumulative installed capacity at the end of 2010 [12, 13, 14].
Germany had the biggest market with 7.4 GW [13]. The German market growth is directly correlated to the introduction of the Renewable Energy Sources Act or “Erneuerbare Energien Gesetz” (EEG) in 2000 [15]. This law introduced a guaranteed feed-in tariff for electricity generated from solar photovoltaic systems for 20 years and already had a fixed build in annual decrease, which was adjusted over time to reflect the rapid growth of the market and the corresponding price reductions. Due to the fact that until 2008 only estimates of the installed capacity existed, a plant registrar was introduced from 1 January 2009 on.
The German market showed to installation peaks during 2010. The first one was in June, when more than 2.1 GW were connected to the grid prior to the 13% feed-in cut which took effect on 1 July 2010. The second peak was in December with almost 1.2 GW just before the scheduled tariff reduction of another 13% on 1 January 2011. Compared to 2009, the feed-in tariff has been reduced by 33 to 36% depending on the system size and classification.
Italy again took the second place with respect to new installations and added a capacity of about 2.5 GW bringing cumulative installed capacity to 3.7 GW at the end of 2010 [14]. The Conto Energia 2011 − 2013 foresaw a 20% cut in the tariff in 2011 compared to 2010, but the tremendous market growth led to a revision of the support scheme, which outcome is still pending at the time of writing this paper.
The Czech Republic was the third largest market in Europe photovoltaic systems with more than 1.3 GW of new installations in 2010 reaching a cumulative nominal capacity of 1.8 GW and exceeding their own target of 1.65 GW set in the National Renewable Action Plan for 2020. The law on the Promotion of Production of Electricity from Renewable Energy Sources went into effect on 1 August 2005 and guarantees a feed-in tariff for 20 years. The annual prices are set by the Energy Regulator. The Producers of electricity can choose from two support schemes, either fixed feed-in tariffs or market price + Green Bonus. The 2011 feed-in rate in the Czech Republic was cut by almost 50% to CZK 5.5 per kilowatt hour (0.23 /kWh). In addition, from 1 March 2011, the tariff only applies to roof-top and facade-integrated PV installations with a capacity of up to 30 kW.
Spain is second regarding the total cumulative installed capacity with 3.9 GW. Most of this capacity was installed in 2008 when the country was the biggest market with close to 2.7 GW in 2008 [9]. This was more than twice the expected capacity and was due to an exceptional race to install systems before the Spanish Government introduced a cap of on the yearly installations in the autumn of 2008. A revised decree (Royal Decree 1758/2008) set considerably lower feed-in tariffs for new systems and limited the annual market to 500 MW with the provision that two thirds are rooftop mounted and no longer free field systems. These changes resulted in a new installed capacity of about 100 MW and about 380 MW in 2010.
In 2010 the Spanish Government passed the Royal Decrees 1565/10 [16] and RD-L 14/10 [17]. The first one limits the validity of the feed-in tariffs to 28 years while the later reduces the tariffs by 10% and 30% for existing projects until 2014. Both bills are “retroactive” and the Spanish Solar Industry Association (ASIF) [18] already announced to take legal actions against them.
France saw another year of massive growth in new photovoltaic system installations with 720 MW of new installations breaking the 1 GW threshold for cumulative installed capacity in 2010. This rapid growth led to a revision of the feed-in scheme in February 2011 setting a cap of 500 MW for 2011 and 800 MW for 2012 [19].
The new tariff levels only apply to rooftop systems up to 100 kW in size. In addition, those installations are divided into three different categories: residential; education or health; and other buildings with different feed-in tariffs depending on the size and type of installation. The tariffs for these installations range between 0.2883 /kWh and 0.46 /kWh. All other installations up to 12 MW are just eligible for a tariff of 0.12 /kWh.
Belgium had another strong market performance in 2010 with new photovoltaic system installations of about 355 MW bringing the cumulative installed capacity to 740 MW according to the Flamish Regulator VREG (Vlaamse regulator van de elektriciteits- en gasmarkt). Most of the installations were done in Flanders, where since 1 January 2006 Green certificates exist which had a value of 0.35 /kWh for 20 years in 2010. In 2011 Flanders is confronted with a legislation proposal, that will further bring down the value of green certificates for solar PV from the 0.33/kWh, which were set in January 2011 in three-month steps each of 0.02 − 0.04/kWh.
Greece introduced a new feed-in-tariff scheme on 15 January 2009. The tariffsremeined unchanged until August 2010 and are guaranteed for 20 years. However, if a grid connection agreement was signed before that date, the unchanged FIT was applied if the system is finalised within the next 18 months. For small rooftop PV systems an additional programme was introduced in Greece on 4 June 2009. This programme covers rooftop PV systems up to 10 kWp (both for residential users and small companies). In 2011 the tariffs decreased by 6.8% to 8.5% depending on the size and location of the installation. In 2010 about 150 MW of new installations were carried out bringing the total capacity to about 180 MW.
The United Kingdom introduced of a new feed-in tariff scheme in 2010, which led to the installation of approximately 55 MW bringing the cumulative installed capacity to about 85 MW. However, in March 2011, the UK government has proposed significant reductions of the tariffs, especially for systems larger 50 kW.
The markets in the remaining European countries are still small and according to the National Renewable Energy Action Plans submitted to the European Commission in 2010 there are now plans to significant growth.
3.2 Asia and Pacific Region
In 2010 the Japanese market experienced a high growth, doubling its volume to 960 MW bringing the cumulative installed PV capacity to 3.6 GW. In 2009 a new investment incentive of U70 000 per kW for systems smaller than 10 kW and a new surplus power purchase scheme with a purchase price of U48 per kWh from systems smaller than 10 kW was introduced and the discussion about a wider feed-in tariff were started.
In April 2011, METI (Ministry for Economy, Trade and Industry) announced a change in the feed-in tariffs and increased the tariff for commercial installations from U20 to 40 per kWh and decreased the tariff for residential installations to U42 per kWh.
The Chinese PV market more than tripled again in 2010 with market estimates in the range of 530 to 690 MW bringing the cumulative installed capacity to about 1 GW. Despite this fact, the home market is still less then 10% of total Photovoltaic production. This situation might change because of the revision of the PV targets for 2015 and 2020. According to press reports, the National Energy Administration is seriously considering to rise the 5 year target for PV to 10 GW in 2015 and further up to 50 GW in 2020.
In January 2009, the Korean Government had announced the third National Renewable Energy Plan, under which renewable energy sources will steadily increase their share of the energy mix between now and 2030. The plan covers such areas as investment, infrastructure, technology development and programmes to promote renewable energy. The new plan calls for a Renewable Energies share of 4.3% in 2015, 6.1% in 2020 and 11% in 2030. In 2010 about 180 MW of new PV installations brought the cumulative capacity to 0.7 GW.
For India 2010 market estimates for solar PV systems vary between 50 to 100 MW. The launching of the Indian National Solar Mission in January 2010 gave impetus to the markets, but the majority of the announced projects will come online from 2011 onwards. The National Solar Mission aims to make India a global leader in solar energy and envisages an installed solar generation capacity of 20 GW by 2020, 100 GW by 2030 and 200 GW by 2050. The short term outlook until 2013 was improved as well when the original 50 MW grid connected PV system target in 2012 was changed to 1000 MW in 2013.
It is worthwhile to mention that the Asian Development Bank (ADB) launched an Asian solar energy initiative in 2010, which should lead to the installation of 3 GW of solar power by 2012. ADB will provide US$ 2.25 billion (1.73 billion) to finance the initiative, which is expected to leverage an additional US$ 6.75 billion (5.19 billion) in solar power investments over the period.
3.3 North America
In the USA new grid connected PV installations of 878 MW increasing the cumulative capacity to 2.1 GW were reported by the Solar Energy Industries Association (SEIA) for 2010 [10]. In addition there are another 4 to 500 MW off-grid installations. Over the last 5 years, the market share of grid connected residential PV systems was pretty constant in the 30% range, whereas the utility market showed the largest increase from 1% back in 2005 to 28% in 2010.
Many State and Federal policies and programmes have been adopted to encourage the development of markets for PV and other renewable technologies. These consist of direct legislative mandates (such as renewable content requirements) and financial incentives (such as tax credits). One of the most comprehensive databases about the different support schemes in the US is maintained by the Solar Centre of the State University of North Carolina. The Database of State Incentives for Renewable Energy (DSIRE) is a comprehensive source of information on State, local, utility, and selected federal incentives that promote renewable energy. All different support schemes are described there and it is highly recommended to visit the DSIRE web-site http://www.dsireusa.org/ and the corresponding interactive tables and maps for details.
In 2010 Canada more than tripled its cumulative installed PV capacity to about 420 MW with 300 MW new installed systems. This development was driven by the introduction of a feed-in tariff in the province of Ontario enabled by the “Bill 150, Green Energy and Green Economy Act, 2009”. On the federal level only a accelerated capital cost allowance exists under the income tax regulations. On a province level, nine Canadian Provinces have Net Metering Rules with solar photovoltaic electricity as one of the eligible technologies, Sales Tax Exemptions and Renewable Energy Funds exist in two Provinces and Micro Grid Regulations and Minimum Purchase Prices each exist in one Province.
4 Conclusions and outlook
New investment in clean energy technologies, companies, and projects increased in 2010 by 30% compared to 2009 and reached $243 billion (187 billion) [1]. China held largest share of investments with 22.4% followed by Germany with 17% and the USA with 14% [20]. Total 2010 worldwide investment in solar energy reached $79 billion (61 billion) and was second only to wind with $95 billion (73 billion).
The Photovoltaic Industry has changed dramatically over the last few years. China has become the major manufacturing place followed by Taiwan, Germany and Japan. Amongst the 15 biggest photovoltaic manufacturers in 2010, only three had production facilities in Europe, namely First Solar (USA, Germany and Malaysia), Q-Cells (Germany and Malaysia) and Solarworld (Germany and USA).
The implementation of the 100 000 roofs programme in Germany in 1990 and the Japanese long-term strategy set in 1994, with a 2010 horizon, were the start of an extraordinary PV market growth. Before the start of the Japanese market implementation programme in 1997, annual growth rates of the PV markets were in the range of 10%, mainly driven by communication, industrial and stand-alone systems. Since 1990 PV, production has increased almost 500-fold from 46 MW to about 23.5 GW in 2010. This corresponds to a CAGR of 36% over the last twenty years. Statistically documented cumulative installations world-wide accounted for over 39 GW in 2010. The interesting fact is, however, that cumulative production amounts to 53 GW over the same time period. Even if we do not account for the roughly 5 GW difference between the reported production and installations in 2010, there is a considerable 9 GW capacity of solar modules which are statistically not accounted for. Parts of it might be in consumer applications, which do not contribute significantly to power generation, but the overwhelming part is probably used in stand-alone applications for communication purposes, cathodic protection, water pumping, street, traffic and garden lights, etc.
The temporary shortage in silicon feedstock, triggered by the high growth-rates of the photovoltaics industry over the last years, resulted in the market entrance of new companies and technologies. New production plants for polysilicon, advanced silicon wafer production technologies, thin-film solar modules and technologies, like concentrator concepts, were introduced into the market much faster than expected a few years ago.
Even with the current economic difficulties, the increasing number of market implementation programmes world-wide, as well as the overall rising energy prices, the need to re-evaluate the validity of a nuclear option after the tragic events in Fukujima, Japan, in March 2011 and the pressure to stabilise the climate, will continue to keep the demand for solar systems high. In the long-term, growth rates for photovoltaics will continue to be high, even if the economic frame conditions vary and can lead to a short-term slow-down. This view is shared by an increasing number of financial institutions, which are turning towards renewables as a sustainable and secure long-term investment. Increasing demand for energy is pushing the prices for fossil energy resources higher and higher. Already in 2007, a number of analysts predicted that oil prices could well hit 100 $/bbl by the end of 2007 or early 2008 [21]. After the spike of oil prices in July 2008, with close to 150$/bbl, prices have decreased due to the world-wide financial crisis and hit a low around 37 $/bbl in December 2008. However, the oil price has rebounced and fluctuates in the 70 to 90 $/bbl range since August 2009. It is obvious that the fundamental trend of increasing demand for oil will drive the oil price higher again. Already in March 2009, the IEA Executive Director, Nobuo Tanaka, warned in an interview that the next oil crisis with oil prices at around 200 $/bbl due to a supply crunch, could be as close as 2013 because of lack of investments in new oil production.
Over the last 20 years, numerous studies about the potential growth of the photovoltaic industry and the implementation of photovoltaic electricity generation systems were produced. In 1996 the Directorate General for Energy of the European Commission published a study “Photovoltaics in 2010” [22]. The medium scenario of this study was used to formulate the White Paper target of 1997 to have a cumulative installed capacity of 3 GW in the European Union by 2010 [23]. The most aggressive scenario in this report predicted a cumulative installed PV capacity of 27.3 GW world-wide and 8.7 GW in the European Union for 2010. This scenario was called “Extreme scenario” and it was assumed that in order to realise it a number of breakthroughs in technology and costs as well as continuous market stimulation and elimination of market barriers would be required to achieve it. The reality check reveals that even the most aggressive scenario is lower than what we expect from the current developments. A cumulative installed capacity of about 39 GW world-wide and 29 GW in Europe was estimated as cumulative installations of PV systems at the end of 2010.
According to investment analysts and industry prognoses, solar energy will continue to grow at high rates in the coming years. The different Photovoltaic Industry Associations, as well as Greenpeace, the European Renewable Energy Council (EREC) and the International Energy Agency, have developed new scenarios for the future growth of PV. Table 1 shows the different scenarios of the Greenpeace/EREC study, as well as the different 2008 IEA Energy Technology Perspectives scenarios.
These projections show that there are huge opportunities for the photovoltaics industry in the future if the right policy measures are taken, but we have to bear in mind that such a development will not happen by itself. It will require the constant effort and support of all stakeholders to implement the envisaged change to a sustainable energy supply with photovoltaics delivering a major part. The main barriers to such developments are perception, regulatory frameworks and the limitations of the existing electricity transmission and distribution structures.
The above-mentioned scenarios will only be possible if new solar cell and module design concepts can be realised, as with current technology the demand for materials like silver would exceed the available resources within the next 30 years. Research to avoid such kind of problems is underway and it can be expected that such bottle-necks will be avoided.
The photovoltaic industry is developing into a fully-fledged mass-producing industry. This development is connected to an increasing industry consolidation, which presents a risk and an opportunity at the same time. If the new large solar cell companies use their cost advantages to offer lower-priced products, customers will buy more solar systems and it is expected that the PV market will show an accelerated growth rate. However, this development will influence the competitiveness of small and medium companies as well. To survive the price pressure of the very competitive market situation, and to compensate the advantage of the big companies made possible by economies of scale that come with large production volumes, they have to specialise in niche markets with high value added in their products. The other possibility is to offer technologically more advanced and cheaper solar cell concepts.
Despite the fact that Europe – especially Germany – is still the biggest world market, the European manufacturers are losing market shares in production. This is mainly due to the rapidly growing PV manufacturers from China and Taiwan and the new market entrants from companies located in India, Malaysia, Philippines, Singapore, South Korea, UAE, etc. Should the current trend in the field of world-wide production capacity increase continue, the European share will further decrease, even with a continuation of the growth rates of the last years. At the moment, it is hard to predict how the market entrance of the new players all over the world will influence future developments of the markets.
A lot of the future market developments, as well as production increases, will depend on the realisation of the currently announced world-wide PV programmes and production capacity increases. During 2009 and 2010, the announcements from new companies which want to start a PV production, as well as established companies to increase their production capacities, continued to increase the expected overall production capacity. If all these plans are realised, thin-film production companies will increase their total production capacities even faster than the silicon wafer-based companies and increase their market share from the 2007 market share of 10% to about 30% in 2015. However, the number of thin-film expansion projects which are caught between the fact that margins are falling, due to decreasing module prices and the need to raise additional capital to expand production in order to lower costs, is increasing.
Already for a few years, we have now observed a continuous rise of oil and energy prices, which highlights the vulnerability of our current dependence on fossil energy sources, and increases the burden developing countries are facing in their struggle for future development. On the other hand, we see a continuous decrease in production costs for renewable energy technologies as a result of steep learning curves. Due to the fact that external energy costs, subsidies in conventional energies and price volatility risks are generally not taken into consideration, renewable energies and photovoltaics are still perceived as being more expensive in the market than conventional energy sources. Nevertheless, electricity production from photovoltaic solar systems have already proved now that it can be cheaper than peak prices in the electricity exchange in a wide range of countries and if the new EPIA and SEIA visions can be realised, electricity generation cost with photovoltaic systems will have reached grid parity in most of Europe and the USA by 2020. In addition, renewable energies are, contrary to conventional energy sources, the only ones to offer a reduction of prices rather than an increase in the future.
Solar cell production capacities mean: in the case of wafer silicon based solar cells only the cells; in the case of thin-films, the complete integrated module; only those companies which actually produce the active circuit (solar cell) are counted; companies which purchase these circuits and make cells are not counted.
The PPVX is a non commercial financial index published by the solar magazine “Photon” and “Öko-Invest”. The index started on 1 August 2001 with 1000 points and 11 companies and is calculated weekly using the Euro as reference currency. Only companies which made more than 50% of their sales in the previous year with PV products or services are included [Pho 2001].
Please note that the composition of the index changes as new companies are added and others have to leave the index.
High concentration >300 suns (HCPV); medium concentration 5 < x < 300 suns (MCPV); low concentration <5 suns (LCPV).
References
- World Economic Forum, April 2011, Green Investing 2011 – Reducing the Cost of Financing, Ref. 200311 [Google Scholar]
- P. Mints, Manufacturer Shipments, Capacity and Competitive Analysis 2009/2010. Navigant Consulting Photovoltaic Service Program, Palo Alto, CA. [Google Scholar]
- Photon Interanational, March 2011 [Google Scholar]
- PV News, published by The Prometheus Institute, ISSN 0739-4829 [Google Scholar]
- P. Mints, Global PV Demand 2011 and Beyond, Webinar: Vote Solar, January 12, 2011 [Google Scholar]
- Mercom, Market Intelligence Report, 4 April 2011 [Google Scholar]
- iSupply, PV Perspectives, February 2011 [Google Scholar]
- Bundesverband Solarwirtschaft, Preisindex Photovoltaik http://www.solarwirtschaft.de/preisindex [Google Scholar]
- European Photovoltaic Industry Association, Global Market Outlook for Photovoltaics until 2015, 2011 [Google Scholar]
- Solar Energy Industry Association, March 2011, US Solar Market InsightTM, 2010 Yearin review, Executive Summary [Google Scholar]
- Photovoltaic Energy Barometer, Systèmes Solaires, le journal du photovoltaique n° 3 – 2011, April 2011, ISSN 0295-5873 [Google Scholar]
- Photovoltaic Energy Barometer, Systèmes Solaires, le journal du photovoltaique n° 5 – 2011, April 2011, ISSN 0295-5873 [Google Scholar]
- German Federal Network Agency (Bundesnetzagentur), Press Release 21 March 2011 [Google Scholar]
- Gestore Servici Energetici, Press Release, 15 February 2011 [Google Scholar]
- Gesetz für den Vorrang erneuerbarer Energien vom 29. März 2000; Bundesgesetzblatt Jahrgang 2000 Teil I Nr.13 S. 305 ausgegeben am 30. März 2000 [Google Scholar]
- Royal Decree 1565/10, published on 23 November 2010 http://www.boe.es/boe/dias/2010/11/23/pdfs/BOE-A-2010-17976.pdf [Google Scholar]
- Royal Decree RD-L 14/10, published on 24 December 2010 http://www.boe.es/boe/dias/2010/12/24/pdfs/BOE-A-2010-19757.pdf [Google Scholar]
- Asociación de la Industria Fotovoltaica (ASIF), http://www.asif.org/principal.php?idseccion=565 [Google Scholar]
- Ministère de l’Économie, de l’industrie et de l’emploi, Press Release, 24 February 2011 [Google Scholar]
- The PEW Charitable Trust, 2011, Who’s Winning the Clean Energy Race? G-20 Investment Powering Forward [Google Scholar]
- International Herald Tribune, 24 July 2007 http://www.iht.com/articles/2007/07/24/bloomberg/bxoil.php [Google Scholar]
- European Commission, Directorate-General for Energy, Photovoltaics in 2010, Office for Official Publications of the European Communities, 1996, ISBN 92-827-5347-6 [Google Scholar]
- Energy for the Future: Renewable sources of energy; White Paper for a Community Strategy and Action Plan, COM(1997)599 final (26/11/97) [Google Scholar]
- Greenpeace International, European Renewable Energy Council (EREC), 2010, energy [r]evolution, June 2010 [Google Scholar]
- International Energy Agency, 2008, Energy Technology Perspectives – Scenarios & Strategies to 2050, ISBN 9789264041424 [Google Scholar]
- International Energy Agency, 2010, PV Technology Roadmap [Google Scholar]
All Tables
All Figures
|
Fig. 1 World PV Cell/Module Production from 2000 to 2010 (data source: Navigant [2], Photon Magazine [3], PV News [4] and own analysis). |
| In the text | |
|
Fig. 2 World-wide PV Production and planned production capacity increases. |
| In the text | |
|
Fig. 3 2006 and planned PV Production capacities of Thin-Film and Crystalline Silicon based solar modules. |
| In the text | |
|
Fig. 4 Annual photovoltaic installations from 2000 to 2010 (data source: EPIA [9], Eurobserver [11] and own analysis). |
| In the text | |
|
Fig. 5 Cumulative Photovoltaic Installations from 2000 to 2009 (data source: EPIA [9], Eurobserver [11] and own analysis). |
| In the text | |
Current usage metrics show cumulative count of Article Views (full-text article views including HTML views, PDF and ePub downloads, according to the available data) and Abstracts Views on Vision4Press platform.
Data correspond to usage on the plateform after 2015. The current usage metrics is available 48-96 hours after online publication and is updated daily on week days.
Initial download of the metrics may take a while.