| Issue |
EPJ Photovolt.
Volume 17, 2026
Special Issue on ‘EU PVSEC 2025: State of the Art and Developments in Photovoltaics', edited by Robert Kenny and Carlos del Cañizo
|
|
|---|---|---|
| Article Number | 10 | |
| Number of page(s) | 10 | |
| DOI | https://doi.org/10.1051/epjpv/2026003 | |
| Published online | 23 February 2026 | |
https://doi.org/10.1051/epjpv/2026003
Original Article
Differences between economical, ecological and societal optimal designs of solar parks due to feed-in restrictions
TNO Energy and Materials Transition – Solar Energy, Westerduinweg 3, 1755 LE Petten, the Netherlands
* e-mail: This email address is being protected from spambots. You need JavaScript enabled to view it.
Received:
24
September
2025
Accepted:
21
January
2026
Published online: 23 February 2026
Abstract
With increasing market share of distributed, renewable electricity generation, challenges like net congestion, become increasingly relevant. Solar parks in northwest Europe are generating electrical energy homogeneously over the full capacity range. To increase the utilisation of the grid connection, the AC:DC ratio, the grid export limit relative to installed DC capacity, of solar parks is reduced which clips the high production hours. In this work, we investigate how such an external force changes the optimal design of solar parks for lowest levelised cost of electricity and average capture price and how it depends on other factors such as module price and land cost. We show that costs and a low AC:DC ratio shift the optimal design to low angle and high ground coverage ratio. On the other hand, energy yield per panel and ecological considerations favour higher tilt angles and lower ground coverage ratio.
Key words: bifacial PV / LCoE / ecology / net congestion / AC:DC ratio / solar park design
© B.B. Van Aken and I. Cesar, Published by EDP Sciences, 2026
 This is an Open Access article distributed under the terms of the Creative Commons Attribution License (https://creativecommons.org/licenses/by/4.0), which permits unrestricted use, distribution, and reproduction in any medium, provided the original work is properly cited.
1 Introduction
The realisation of solar parks on land faces many challenges, including the business case, grid connectivity, and permitting. In countries like the Netherlands, where there is a high penetration of solar electricity and low flexible demand, revenues are declining due to oversupply, resulting in low capture prices [1]. Additionally, feed-in restrictions are imposed to improve the efficient use of grid connections, e.g. the German electricity feed-in law EEG [2] or the Dutch SDE++-scheme. The latter requires a maximum feed-in capacity of 50% of the nominal power output of the PV modules. Consequently, solar parks are clipped and curtailed due to connection limitations and negative clearing prices.
On the other hand, high penetration of solar electricity, often abbreviated as PV, photovoltaics, also impacts societal resistance and re-prioritisation of land use. Multiple land use propositions, such as nature-inclusive solar parks and the combination with agriculture, are favoured in this context, providing more room for new permits. Recently, nature-inclusive solar parks have been incentivised in the Netherlands by the national subsidy scheme, and a certification process for nature-inclusive solar parks [3] is launched. This initiative aims to accelerate the realisation of solar parks with improved biodiversity and maintenance of soil quality compared to previous land use. At the European level, a policy paper by The Nature Conservatory and Solar Power Europe [4] explores how nature-inclusive solar parks can contribute to the EU’s nature protection and restoration ambitions, such as the Green Deal and the Nature Restoration Law.
Ground-mounted solar parks are both a risk factor for soil quality but, when designed and constructed correctly also offer an opportunity for soil and biodiversity restoration. In open grasslands, rain and light is homogeneously distributed. In contrast, the shading by PV modules or arrays and the run-off from precipitation intercepted by them leads to a very heterogeneous distribution [5]. These gradients affect the division of photosynthesis and carbon fixation over the land [6]. Gradients typically promote biodiversity, but the conditions under the PV arrays increases the risk of invasive species [7]. There are many observations that plants like common nettle and blackberry are relatively common in the darker areas of solar parks [8].
Microbial growth below the PV arrays reacts to changes in the light and rainfall in dry ecosystems and vegetation below solar panels shows less growth when the water availability is low [9]. Less photosynthesis and less growth of vegetation and microbes, leads to a lower intake of carbon in the soil [10]. The response of vegetation to the amount of light, compared to ambient, exhibits three levels, <10%, 10%–40% and >40%. Above medium-high light levels, say 40% of the GHI, there will be sufficient photosynthesis. And below 10%, there will be very little plant growth. For light levels between 10% and 40%, the results are less well-defined and are probably strongly influenced by other parameters like water/humidity, previous land use and nutrient and mineral levels in the soil [11–14]. Also the building of the solar park affects the plant biodiversity and restoration success negatively. Although some more shade-tolerant species showed similar growth in the solar park and in the reference case [13]. Initial results on the biomass, below- and above-ground showed higher levels in the aisles between the arrays compared to below the PV arrays, but this was not yet accompanied by a reduction in the organic carbon content of the soil [10].
In this paper, we show how the proposition of nature-inclusive solar parks is severely hindered by recent market developments and discuss solution paths to mitigate these effects. Reduced production due to clipping and curtailment decreases the yield per installed panel, which influences the economic design of solar parks. High yields per panels come at specific costs related to land use, power electronics, construction, cabling, and operations & maintenance which can be avoided at lower yields. The latter allows for configurations in which panels are installed at lower tilt angles and increasing the ground coverage ratio as row-to-row shading is reduced. A combination that increases the electricity production per unit land but reduces the light received by the vegetation below and between the panels. Co-development of solar parks with batteries are one way to overcome curtailments and clipping losses and thus promoting high yields per panel which in turn improves light-sharing in nature-inclusive solar parks.
2 Material and methods
We applied a cost model to calculate the levelised cost of electricity, LCoE [15]. The levelised costs of electricity, LCoE, is the ratio between the total costs of the solar park and the total energy generation during its lifetime, taking into account degradation of the yield and discounting both energy yield and costs. In the cost model the annual operational expenditures, OPEX, are discounted with a real weight averaged cost of capital, WACC of 3.9%, based on a nominal WACC of 6.0% and 2.0% inflation. Result trends do not change with variations in WACC. The annual yield calculation takes into account an annual degradation of 0.5% and is also discounted. The capital expenditure, CAPEX, and OPEX values depend on the area needed, the number of PV modules and the nominal DC and AC capacity. We added to the model that the CAPEX costs for mounting and cabling depending on the height, tilt angle and size of the PV arrays, to account for the amount of material needed, the wind load and the number of poles and foundation. Based on 2019 or 2024 full year meteorological data, the hourly simulation with BIGEYE yielded the annual generation of solar electricity, used to calculate the LCoE over the project lifetime of 25 years.
The ground coverage ratio, GCR, is defined as the module area over land area ratio [16] often calculated from the array (diagonal) length and the heart-to-heart distance of two arrays. Spacing between modules along short and/or long edges lead to minor corrections, particularly when these spacings are not the same. Note that this parameter is not the same as the coverage when looking down on the land. The GCR affects the amount of land needed per PV array, which changes the annual land lease costs. But also, the CAPEX increases if the same number and design of PV arrays is built on a larger plot of land. More ground to prepare, longer cables, longer distances to travel. The same holds for operational costs: larger plot means more green maintenance, more fencing, larger distances. From 105% GCR to 25% GCR the CAPEX per kWp increases with 25%, whereas the OPEX including land lease costs almost triples. The values for two solar park designs are given in Table 1.
The energy yield and irradiance on the ground is simulated with BIGEYE. It is a view-factor based modelling tool that takes the direct and diffuse light into account. It also handles the light scattered by the ground and nearby objects [17]. BIGEYE has been favourably compared to other modelling tools, in particular for vertical orientation [18]. In addition, BIGEYE has been validated to a small PV array of 8 by 9 modules in vertical orientation [19] and to a 1-MW HSAT system [17]. For this work, we used observed weather data for Amsterdam, the Netherlands with a timestep of 1 h. The irradiance on the ground is simulated with a triangular grid with 0.25 m initial step size. The simulated solar park is placed above a smooth surface with albedo of 20% and no slope.
The DC string power is corrected for AC:DC conversion losses of 2% in the inverter, common utility scale inverters have a European efficiency of 98–99%. The model accounts for both clipping due to inverter sizing and grid connection restrictions and for curtailment, in this case due to non-positive clearing prices on the day-ahead market. To take the AC:DC ratio, the grid export limit relative to installed DC capacity, into consideration, we first simulate the potential energy yield for all solar park designs at all time steps. Post-simulation we add the AC:DC ratio constraint. For each hourly timestep the simulated DC power was, if needed, limited to the maximum AC power. In addition, we have reduced the CAPEX to reflect the smaller costs for power electronics, AC cabling and grid connections.
The clearing price is the price at which the demand for electricity matches the biddings for supply [1]. Typically, for each timestep all generators will receive the same price if their bid is on or below the clearing price. However, due to bidding strategies and variability in generation profile, in particular for renewable energy that depends on the availability of wind or solar resources, each generator will receive over a period a different income over the energy it supplied. The clearing price is market-wide and is often reported as a time-averaged price. In contrast, the capture price is generator specific and is, by definition, a volume-weighted average price.
Clearing prices were obtained from the day-ahead APEX market [20] in 2019 and 2024 for the Netherlands and are strictly synchronous as the weather, in particular the wind speed and solar irradiance, is increasingly affecting the market prices with larger market penetration by these renewable electricity sources. The clearing prices are used to calculate the actual capture price for the various solar parks designs and AC:DC ratios studied.
The year 2019 represents a typical year, before large scale market penetration by solar energy in the Netherlands and not affected by COVID-19 pandemic or the invasion of Ukraine, both having a strong influence on energy demand and supply. To represent the situation with a much larger share of solar electricity, the most recent year, 2024, is picked. The cumulative PV installation in the Netherlands grew from 4.6 GW at the beginning of 2019 to 25.4 GW at the end of 2024 [21]. In 2019, solar electricity accounted for 4.4% of the annual electricity demand. This rose to 18% in 2024 [21]. In many electricity markets, without sufficient flexible demand, a large growth in variable, renewable energy generators has led to near-zero and even negative clearing prices. The number of non-positive, hourly clearing prices [20] on the Dutch day-ahead market has risen from 5 hours in 2019 to 542 hours in 2024. Nearly 90% of those occurred during daylight hours.
Overview of economic input assumptions for two different solar park designs.
3 Results
We have simulated a solar park in the Netherlands with PV arrays with three panels in portrait orientation. The azimuth of the solar park is due South. The simulation assumes PV modules of 2278×1134 mm2 with a nominal capacity of 600 Wp and bifacial n-TOPCon technology with a bifaciality factor of 80%. The 2 cm distance between the modules in a PV array along both the long (diagonal) and short (horizontal) edges give an effective PV array transparency of 2.3%. The ground clearance, or minimum height of the arrays is constant at 100 cm. Tilt angle and pitch were varied in the simulations. The simulation comprised of six PV arrays at constant spacing. The reported performance is extracted from the fourth array, counting from the South. The irradiance on that array and its surrounding is representative for most arrays in a utility-scale solar parks and prevents edge effects.
3.1 Solar parks at 100% AC:DC ratio
The specific DC energy yield, or full load hours, are plotted in Figure 1. It shows that at high GCR, above 75%, the energy yield decreases with increasing GCR, as shading losses by the PV array in front increases. This trend is continued towards low GCR: lower GCR increases the energy yield as shading losses are further reduced. However, at low tilt angle, the energy yield becomes constant when shade losses become negligible, e.g. below 80% GCR and tilt of 5°. For higher tilt angles, this occurs at increasingly lower GCR values. As a result, the highest specific yield is observed at high tilt angle and low GCR when shading is negligible and the bifacial panels have the optimal angle to receive the best combination of direct and diffuse light on both sides.
Figure 2 shows the energy yield density. High yields are obtained for high ground coverage ratios, say above 75%. For those GCR values, the highest energy yield densities are generated at low tilt angles, as higher tilt angles will cause more losses due to shading. With decreasing GCR the energy yield density drops rapidly, with little dependence on the tilt angle.
The energy yield density is determined by the combination of how well each PV module is oriented with respect to the sun positions over the sky dome, the density of PV modules, the conversion efficiency of the panels and the shading losses. The first two parameters also determine how much light is not incident on the PV modules. This light will pass the between the PV arrays, and through the gap between the PV modules within a PV array and reach the vegetation on the ground. The average ground irradiance is therefore higher when the energy yield density is lower; this ignores the shading losses which are most relevant in the top-right corner of Figure 2 at high GCR and high tilt angle. Thus, for example, the points on the 100 kWh/m2 line will all have the same average ground irradiance. But the distribution of the ground irradiance will depend also on the tilt angle and GCR combination. The more horizontal designs will lead to a more homogeneous distribution, whereas the designs with the highest tilt angles will result in more pronounced darker and brighter regions.
We note that the bifacial contribution increases due to two causes. First, with decreasing GCR the irradiance on the ground increases, leading to more ground-reflected light. The rear side of the PV modules will absorb most of the ground-reflected light. Second, the rear side of the PV modules will receive more diffuse light from the sky dome when the panels are oriented at a steeper angle and in addition, the contribution from the sky dome will also increase somewhat when the row-row distance increases.
These two figures show that there is not a single optimum design for solar parks. For example, if the performance of the PV modules is leading, for instance when minimising energy, CO2 payback time or rare materials consumption, the best designs are at low GCR and high tilt angle see Figure 1. In contrast, if land usage is more important, the optimum is at high GCR and low tilt angle, see Figure 2.
We plotted in Figure 3 the LCoE for the full range of GCR and tilt angle. We have assumed a 100% AC:DC ratio in this instance. The LCoE rise quickly when GCR decreases below 50%–40%, partly due to the combination of relatively high land lease costs and low kWh-yield per hectare at low GCR. The LCoE also increases above GCR 90%. This is caused by the low kWh-yield per panel at high GCR and the shading losses. A broad range with fairly low LCoE values, below 64 Euro/MWh, is observed. The lowest LCoE, 58 Euro/MWh, is observed at 80% GCR and 6° tilt angle, but at 60% GCR and 25° tilt angle, the LCoE has increased only to 60 Euro/MWh.
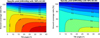 |
Fig. 1 Specific yield in kWh/kWp as function of the ground coverage ratio and the tilt angle of the PV arrays. (Left) assuming a 100% AC:DC ratio, (right) assuming a 50% AC:DC ratio. |
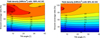 |
Fig. 2 Energy yield density in kWh/m2 as function of the ground coverage ratio and tilt angle of PV arrays. The AC:DC ratio used in the calculations was 100% (left) and 50% (right). |
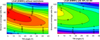 |
Fig. 3 Levelised cost of electricity, LCoE as function of ground coverage ratio, GCR, and tilt angle. Note that the contour lines are not at constant distance: up to 68 Euro/MWh, the intervals are 2 Euro/MWh, above 68 Euro/MWh the intervals are 4 Euro/MWh. (Left) full grid connection, (right) grid connection restricted to 50% of nominal DC power. |
3.2 Solar parks at 50% AC:DC ratio
It is common to optimise the nominal capacity of grid connection, transformers, inverters and module strings for utility-scale solar parks to achieve the lowest LCoE or highest rate of return. In particular, in orientations or situations where the expected maximum power output is (much) lower than the nominal DC power rating of the PV panels, e.g. solar parks oriented away from due South, solar parks with nearly horizontal or vertical panels or PV modules on façades. In that case, the AC capacity of the inverters will never be fully used and the business case will be worse due to the associated higher costs of a high AC inverter capacity without any increase in solar electricity generation. The same holds for PV system that combine several arrays with different production profiles, e.g. a combination of SW-oriented and SE-oriented fields. The ratio of DC module power and AC inverter capacity is called the inverter loading ratio, but is also referred to as DC:AC ratio [22].
We note that an inverter loading ratio, or DC:AC ratio of 2.0, corresponds to a AC:DC ratio of 50%, if and only if all other components and grid connection have, at least, the same AC capacity as the inverters. In this paper, the focus is not on optimising inverter capacity factors, but to investigate what happens with generation performance and economics when the grid connection is limiting. In accordance with the Dutch feed-in subsidy scheme, we have applied a feed-in capacity of 50% of the nominal power of the PV modules. We have assumed that for an AC:DC ratio of 50%, all AC components are rated at 50% of the DC capacity, except for the inverters, which are rated at the average of AC and DC capacity, 75% of the DC capacity.
For the range of solar parks described in the section above, we have reduced the AC:DC ratio to 50%. To qualify for feed-in subsidy in the Netherlands, the contracted grid capacity cannot be larger than 50% of the installed DC power of the PV modules. Obviously, this means that for many time steps the AC output is reduced, but this is not a uniform effect. The 100% AC:DC ratio data in Figures 1 and 2 are reprocessed with the above mentioned 50% AC:DC ratio and the resulting graphs are shown in the righthand panels of Figures 1 and 2.
The specific yield graphs, Figure 1, show a clear reduction when applying a 50% AC:DC ratio. This effect is most pronounced for solar parks with low GCR and high tilt angle, where the PV modules are best oriented towards the sun and the row-on-row shading is minimised. For high GCR, 90% and higher, there is hardly any decrease in specific yield, as in those situations the DC output of a string is hardly ever more than 50% of the nominal capacity.
The changes in yield density, Figure 2, from 100% to 50% grid connection appear more homogeneous. The maximum yield density decreases from 160 kWh/m2 to 150 kWh/m2 with 50% AC:DC restriction but still the highest yield density is obtained at low tilt angle and high GCR.
The righthand panel of Figure 3, shows the LCoE values after applying the 50% AC:DC restriction. Clearly, for most solar park designs under consideration the LCoE increases significantly. For high GCR, >80%, the increase in LCoE mostly depends on the GCR value and not on the tilt angle, with lowest increases for GCR near 100%. Below 80% GCR, the increase in LCoE when applying a 50% AC:DC restriction increases both with increasing tilt angle and with decreasing GCR.
In Figure 1, we saw the relation between the design parameters, tilt angle and GCR, and the corresponding LCoE. This was based on a large set of widely varying designs. For a more detailed analysis based on hourly data, it is more convenient to restrict the number of designs under consideration. As there was a broad range of solar park designs with LCoE close to the lowest value, we selected four designs, varying only in GCR and tilt angle, from the broad range of designs that have LCoE < 62 Euro/MWh. These four solar park designs with GCR between 80% and 55% and tilt angle between 6° and 30° collectively illustrate the trade-off between designs purely based on economic arguments, i.e. low tilt angle and high GCR, and designs that leave more room for ecology, i.e. higher tilt angles and lower GCR.
3.3 Detailed results for the four solar park designs
As renewable energy source, it is important that photovoltaics also take environmental aspects into account [3], including amongst others biodiversity and soil quality. Both depend strongly on photosynthesis by the vegetation between and below the PV arrays. The availability and distribution of light is the parameter most directly affected by the installation of ground-mounted PV [23]. Two design parameters that have a large effect on the light distribution are the GCR and the tilt angle, as studied here. We note that also the light-transmittance of the PV panels and the distance between panels within a PV array have a large effect on the irradiance reaching the ground [24].
Solar parks with low tilt angle and high GCR, for instance 80% GCR and 6° tilt angle, will have a small amount of light passing the PV arrays and reaching the ground. In particular, below the PV arrays the irradiance will be extremely low. On the other hand, at 60% GCR and 25° tilt angle, the irradiance on the ground will be much higher, especially in the wider aisles between the PV arrays. At 100% AC:DC ratio, such a nature-inclusive solar park will have a 3% higher than the optimal LCoE, see Figure 3, left. However, under 50% AC:DC restriction (Fig. 3, right), the LCoE of an eco-design is at 9% much higher than the optimal value.
Using BIGEYE, we calculated the ground irradiance for the four solar parks. In Figure 4 the ground irradiance along a cross-section is plotted, with a cross-section of the PV array position, spacing and tilt angle plotted above. The curves of the irradiance on the ground show changes in various aspects. With decreasing GCR, and increasing tilt angle, the minimum irradiance below the PV array increases from 3% to 8% of the open field irradiance approaching the 10% threshold irradiance to maintain soil quality [23]. In 2025, a Dutch quality label for solar parks, related to nature-inclusive design and O&M, has been released. This label will demand higher ground irradiances to maintain soil quality in future updates [3].
Secondly, the irradiance increases more strongly towards the higher end of the PV array. With decreasing GCR, the aisle width increases, thus leading to a significant broadening of the ground irradiance “peak”, e.g. around 25 m in the graph, but also to higher maximum irradiance. The increased irradiance under the PV array is significant because it ensures that some photosynthesis can still take place compared to the worst case with 80% GCR. In the aisles, the substantial increase in irradiance, both in intensity and in total energy, will significantly increase vegetation growth and thus support soil and nature restoration.
To assess a solar park design, not only the cost per generated MWh is relevant, but also the income it will generate. We have calculated the capture price, the volume-averaged value of the produced MWh on the day-ahead market for the four solar park designs for the years 2019 and 2024. Hours with non-positive prices are excluded from the calculation of the annual energy yield and the annual income. These capture prices for 100% AC:DC and 50% AC:DC ratios are plotted in Table 2. Despite the broad range of GCR and tilt angle, these solar parks have near identical capture prices both in 2019 and in 2024, when over 450 h are excluded from the income and yield calculation. At 100% AC:DC ratio, both the capture price and the LCoE for these four designs are more or less the same. In contrast, at 50% AC:DC ratio, the LCoE increases strongly with increasing tilt angle and decreasing GCR, whereas the capture price does not increase. Thus, the feed-in restriction causes a competition between the nature-inclusivity of a solar park and the financial feasibility.
To better understand the impact of the AC:DC ratio on the operations of the solar park, we plot the cumulative generated energy as function of the relative DC power in Figure 5. Whereas the curve for the 80% GCR solar park increases fastest and generates 50% of its annual energy yield at up to 46% nominal power output, with decreasing GCR the slopes become shallower and the 55% GCR solar park reaches 50% only at 53% nominal power output. The changes are particularly clear at highest relative power. The 80% GCR solar park accumulates 95% of its total power at 81% relative power; the 55% GCR reaches this level at 92% relative power. Note that the more energy is generated at lower relative DC power, the less susceptible that solar park design is to losses due to clipping or partial curtailment.
From the data in Figure 5, left, we can deduce how much energy can still be supplied to the grid if the grid connection is limited to a fraction of the nominal DC capacity. These data are plotted in Figure 5, right. For a typical AC:DC ratio of 50%, the solar park with GCR 80% still produces 89% of the power compared to a full grid connection, a loss of 11%. In contrast, the more nature-inclusive solar park with GCR 55% has a 17% loss in energy yield at this AC:DC ratio. In these cases, the costs for grid connection and power electronics are reduced by half and the annual energy yield will decrease by 11–17%. The resulting LCoE and 2024 capture prices are plotted in Figure 6, for these four solar park designs as function of an imposed AC:DC restriction. In particular for the solar parks with the higher GCR, the LCoE initially decreases when applying an AC:DC restriction. Clearly, the initial small variations in LCoE at 100% AC:DC ratio, become larger when going to lower AC:DC ratios, with the lower LCoE obtained for the higher GCR solar park.
The LCoE at 50% AC:DC ratio for the more nature-inclusive solar park is around 5 Euro/MWh, compared to the solar park with 80% GCR. To maintain similar competitiveness, the subsidy intensity for the nature-inclusive solar park should compensate this difference. Note that other measures to improve nature-inclusiveness besides the design of the arrays are not included in this value of 5 Euro/MWh or 0.5 cent/kWh. The capture price shows much less variation. The marginally higher capture price for the 55% GCR solar park at low AC:DC ratio, is disproportionate to the much larger difference in the corresponding LCoE.
Compared to neighbouring countries with similar energy markets and climates, the situation in the Netherlands is markedly different in at least one aspect. The land lease costs are much higher than in say Germany or the United Kingdom. Typical values are in the range of 8 000 Euro per year per hectare. To see if the results are also applicable in cases with much lower or no cost of obtaining a land position, the LCoE calculation is repeated for the case with zero land lease costs in Figure 7.
Obviously, the LCoE values in Figure 7 are lower than in Figure 6. For 100% AC:DC ratio, the land lease contributes 5–6 Euro/MWh. With decreasing AC:DC ratio, these values slowly increase to 6–8 Euro/MW at 50% AC:DC ratio. The designs with the lower GCR values have a larger contribution of the land lease costs. Therefore, the spread in LCoE values for the different solar park designs is lower than in the case with the actual land lease costs.
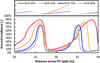 |
Fig. 4 (Top) cross-sections through four solar park designs, (bottom) corresponding ground irradiances. |
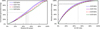 |
Fig. 5 (left) Cumulative generated energy on the vertical axis as function of the relative DC power on the horizontal axis. (right) Relative energy remaining after applying the AC:DC ratio on the horizontal axis. |
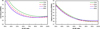 |
Fig. 6 (Left) LCoE and (right) capture price as function of the AC:DC ratio. Note that the LCoE is a discounted value over the lifetime of the solar park, whereas the capture price is the real income over a particular year. |
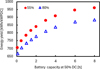 |
Fig. 8 Total energy yield of PV with BESS as function of the storage size, expressed in hours at 50% DC capacity, for the solar park design with 55% GCR, full red circles, and the design with 80% GCR, open blue triangles. |
3.4 Discussion of alternative solutions
Under the grid restriction of 50% AC:DC ratio, the lowest LCoE was obtained for a system with lowest tilt angle and fairly high GCR of 80%. The tilt angle is a practical limit, even lower angles would reduce water run-off and increase the need for and costs of cleaning the PV arrays. This warrants the question whether a east-west system, with alternating PV arrays facing east and facing west, at low tilt angle and high GCR is a better solution in terms of LCoE and yield density, taking into account shading losses, curtailment and clipping. To answer these questions, we compare an east-west design with a low-tilt, high density south-facing solar park. Due to the reduced wind resistance of the east-west system, tables with the same size, tilt and height will have a lower contribution to the total CAPEX for the east-west system.
The east-west system indeed has, even, less shading losses. The energy yield of the south-facing solar park comprises shading losses and inhomogeneous irradiance losses of 1.3%, as reported by BIGEYE. For the east-west solar park this value is smaller than 0.1%. The LCoE at 100% AC:DC, including all hours, is 60.9 Euro/MWh for the south-facing and 62.4 Euro/MWh for the east-west design. Curtailment due to non-positive clearing prices leads to an energy yield loss of 24% for both cases. Clipping losses are larger in the south-facing solar park, the annual energy yield per kWp for the first year is reduced by 11.5% (8.4%), whereas this is only 8.9% (6.3%) for the east-west solar park, with the first value accounting for all hours and the second value in brackets for the hours with positive day-ahead clearing prices. The LCoE at 50% AC:DC and only positive clearing price hours is 82.8 Euro/MWh for the south-facing and 82.4 Euro/MWh for the east-west design. The traditional LCoE, ignoring market conditions and allowing 100% AC:DC ratio, the east-west system led to a 2.5% higher cost of electricity. When excluding production during negative price hours and restricting the grid connection to 50%, the cost of electricity for the east-west system is actually 0.5% cheaper. The major difference is that the east-west system is slightly less sensitive to clipping.
Combining the energy yield of east- and west-facing PV arrays reduces the relative total output: when the east-facing PV arrays are perfectly oriented with respect to the sun, the west-facing ones are off optimum and vice versa. Thus the combined output will show a lower prevalence in the highest performance brackets. That means that compared to the curves in Figure 5, the data points for the east-west system will be slightly above the line for 80% GCR, south-facing. A decrease in the AC:DC ratio will therefore reduce the energy yield less compared to a south-facing system with a much higher prevalence in the higher performance brackets. The relative ground irradiance distribution for the east-west system is very much the same as that of the south-facing system.
Both curtailment due to negative clearing prices and clipping due to grid connection restrictions lead to a significant reduction in the full load hours of solar parks. In particular, for systems that have higher tilt angles and lower GCR exhibit a reduction of more than 30%. The curtailment and clipping is achieved by regulating down or switching off parts of the solar park until the required, maximum power output is reached. Battery energy storage systems can store the electricity that otherwise would not be generated. We applied a simple model that charges the BESS when the system is in curtailment or under clipping conditions, see Figure 8. When the system is no longer restricted, that means the actual solar electricity generation is less than 50% DC capacity and the clearing price is positive, the BESS will discharge to the grid. A BESS with 1 h capacity at 50% DC power can increase the full load hours by about 10%. It is clear that the nature-inclusive park design, with GCR 55%, benefits more from adding a BESS than the industrial solar park in terms of annual specific yield.
4 Conclusion
We investigated the effect of GCR and tilt angle on the energy yield, yield density and LCoE of a south-facing solar park located in NW-Europe. We considered the case without feed-in restrictions and the case with an imposed 50% AC:DC ratio. Without feed-in constraints, the lowest LCoE for a solar park in the Netherlands is found with 65% GCR and tilt angle 20° and an AC:DC ratio of 84% in our simulations. For solar parks with higher GCR and lower tilt angles, the lowest LCoE is found at lower AC:DC ratios. With further decreasing of the AC:DC ratio, the LCoE starts to increase substantially, in particular for low GCR and high tilt angle. Under a 50% AC:DC restriction, the optimal LCoE shifts to high GCR, around 80% and a tilt angle of 6°, arguably limited by technical and operational constraints.
Considering the impact on the soil and the biodiversity, the solar park with the lowest GCR and highest tilt angle shows the highest soil irradiance under the PV arrays, but also the widest aisles with highest irradiance. Such a nature-inclusive solar park design with GCR of 55% and 30° tilt angle has a comparable LCoE, less than 3% higher than the optimal LCoE in the case of unrestricted feed-in. However, under 50% AC:DC ratio, the lowest LCoE is achieved for the most horizontal and compact design with the lowest irradiance under the PV array and the smallest, least bright aisles. The LCoE of an eco-design is 9% higher, or 5 Euro per MWh, than this optimal value.
The capture prices hardly depend on the variation in solar park design in our work. Where the LCoE values differ by a few percent, the differences in capture price turned out to be at most 1%. Since the income hardly increased when installing steeper PV modules, the cost of doing so is less than compensated by the revenues. This is the main reason there is a drive away from nature-inclusive solar parks when feed-in restrictions are imposed. Under these condition higher feed-in subsidies are required to promote the nature-inclusive solar parks. Acceleration of flexible demand or co-located PV + BESS on the other hand will promote this development while it also alleviates the grid congestion problems.
To conclude, applying a 50% AC:DC ratio strongly increased the full load hours of the grid connection. It shifts the design with lowest LCoE towards densely packed solar parks with panels at low tilt angle. This results in a much lower irradiance below and between the PV arrays, which will not be favourable for solar parks that are located on fields where soil restoration is also asked for.
Funding
This work contains results generated in the project SolarEcoPlus and is partially funded by a Topsector Energiesubsidie from the Dutch Ministry of Economic Affairs.
Conflicts of interest
The authors have nothing to disclose.
Data availability statement
The data that support the findings of this study are available from the corresponding author, BBVA, upon reasonable request.
Author contribution statement
Conceptualisation, KC and BBVA; Methodology, KC and BBVA; Software, BBVA; Validation, KC and BBVA; Formal Analysis, BBVA; Investigation, BBVA; Resources, KC; Data Curation, BBVA; Writing – Original Draft Preparation, BBVA; Writing – Review & Editing, KC; Visualisation, BBVA; Supervision, KC; Project Administration, KC; Funding Acquisition, KC.
References
- B.B. Van Aken, P. Verstraten, B.M. Kaas, I. Cesar, Marginal effect of variation in photovoltaic system configuration's generation profiles on price stabilisation in the netherlands compared with deployment of flexible demand and supply, Sol. RRL 6, 2100484 (2022). https://doi.org/10.1002/solr.202100484 [Google Scholar]
- J. Bergner, J. Weniger, T. Tjaden, V. Quaschning, Feed-in power limitation of grid-connected PV battery systems with autonomous forecast-based operation strategies, in Proc. EU PVSEC (2014). https://doi.org/10.4229/EUPVSEC20142014-5CO.15.1 [Google Scholar]
- K.L. Krijgsveld, Y. Aartsma, B.B. Van Aken, A. Berghorst, R. Buij, I. Cesar, G.B. De Deyn, A. Edlinger, T.P.M. Fijen, S. Forouzan Fard, G.A. de Groot, S. Kamerling, T. Kocsis, F. van Langevelde, A. Matson, L. Scholten, S. Schorn, C. Tavernier, M. Vittek, P. van der Wal, EcoCertified Solar Parks. Openbare eindrapportage. WENR-rapport 3453, Wageningen University & Research, Wageningen (2025). https://doi.org/10.18174/699847 [Google Scholar]
- The Nature Conservancy and SolarPower Europe, Rewarding and incentivising nature-inclusive solar through EU policy, Policy paper (2024). https://api.solarpowereurope.org/uploads/Final_Report_Nature_inclusive_solar_parks_Metabolic_Oct_2024_low_Resolution_1_638e462bb3.pdf?updated_at=2024-10-14T21:09:04.783Z [Google Scholar]
- M.A. Sturchio, J.E. Macknick, G.A. Barron-Gafford, A. Chen, C. Alderfer, K. Condon, O.L. Hajek, B. Miller, B. Pauletto, J.A. Siggers, I.J. Slette, A.K. Knapp, Grassland productivity responds unexpectedly to dynamic light and soil water environments induced by photovoltaic arrays, Ecosphere 13, e4334 (2022). https://doi.org/10.1002/ecs2.4334 [Google Scholar]
- A. Armstrong, N.J. Ostle, J. Whitaker, Solar park microclimate and vegetation management effects on grassland carbon cycling, Environ. Res. Lett. 11, 1 (2016). https://doi.org/10.1088/1748-9326/11/7/074016 [Google Scholar]
- D. Uldrijan, J. Winkler, M.D. Vaverková, Bioindication of environmental conditions using solar park vegetation, Environments 10, 86 (2023). https://doi.org/10.3390/environments10050086 [CrossRef] [Google Scholar]
- A. Schotman, F. van der Zee, G. Hazeu, J. Bloem, J. Sluijsmans, M. Vittek, Verkenning van bodem en vegetatie in 25 zonneparken in Nederland: Eerste overzicht van de ligging van zonneparken in Nederland en stand van de kennis over het effect van zonneparken op de bodemkwaliteit (Rapport / Wageningen Environmental Research; No. 3061), Wageningen Environmental Research (2021). https://doi.org/10.18174/541057 [Google Scholar]
- Z. Liu, T. Peng, S. Ma, C. Qi, Y. Song, C. Zhang, K. Li, N. Gao, M. Pu, X. Wang, Y. Bi, X. Na, Potential benefits and risks of solar photovoltaic power plants on arid and semi-arid ecosystems: an assessment of soil microbial and plant communities, Front. Microbiol. 14, 1190650 (2023). https://doi.org/10.3389/fmicb.2023.1190650 [CrossRef] [Google Scholar]
- L. Scholten, R.G.M. de Goede, A. Edlinger, B.B. Van Aken, G.B. De Deyn, Sharing the light, impact of solar parks on plant productivity, soil microbes and soil organic matter, Plants, People, Planet 1 (2025). https://doi.org/10.1002/ppp3.70011 [Google Scholar]
- M. Semchenko, M. Lepik, L. Götzenberger, K. Zobel, Positive effect of shade on plant growth: Amelioration of stress or active regulation of growth rate?, J. Ecol. 100, 459 (2012). https://doi.org/10.1111/j.1365-2745.2011.01936.x [CrossRef] [Google Scholar]
- E.M. Abraham, A.P. Kyriazopoulos, Z.M. Parissi, P. Kostopoulou, M. Karatassiou, K. Anjalanidou, C. Katsouta, Growth, dry matter production, phenotypic plasticity, and nutritive value of three natural populations of Dactylis glomerata L. under various shading treatments, Agrofor. Syst. 88, 287 (2014). https://doi.org/10.1007/s10457-014-9682-9 [CrossRef] [Google Scholar]
- A. Siebenkäs, J. Schumacher, C. Roscher, Phenotypic plasticity to light and nutrient availability alters functional trait ranking across eight perennial grassland species, AoB Plants 7, 1 (2015). https://doi.org/10.1093/aobpla/plv029 [CrossRef] [Google Scholar]
- Q. Lambert, R. Gros, A. Bischoff, Ecological restoration of solar park plant communities and the effect of solar panels, Ecol. Eng. 182, 106722 (2022). https://doi.org/10.1016/j.ecoleng.2022.106722 [Google Scholar]
- E. Vartiainen, G. Masson, C. Breyer, D. Moser, E. Román Medina, Impact of weighted average cost of capital, capital expenditure, and other parameters on future utility-scale PV levelised cost of electricity, Prog. Photovolt. Res. Appl. 28, 439 (2020). https://doi.org/10.1002/pip.3189 [Google Scholar]
- K. Doubleday, B. Choi, D. Maksimovic, C. Deline, C. Olalla, Recovery of inter-row shading losses using differential power-processing submodule DC-DC converters, Sol. Energy 135, 512 (2016). https://doi.org/10.1016/j.solener.2016.06. 013 [Google Scholar]
- A.R. Burgers, BIGEYE − simulation under shadow conditions, in Proc. 6th Workshop Bifacial PV (Amsterdam, the Netherlands, 2019). [Google Scholar]
- H. Nussbaumer, G.J.M. Janssen, D. Berrian, B. Wittmer, M. Klenk, T. Baumann, F. Baumgartner, M. Morf, A.R. Burgers, J. Libal, A. Mermoud, Accuracy of simulated data for bifacial systems with varying tilt angles and share of diffuse radiation, Sol. Energy 197, 6 (2020). https://doi.org/10.1016/j.solener.2019.12.071 [CrossRef] [Google Scholar]
- A.J. Carr, J. Liu, A. Binani, K. Cesar, B.B. Van Aken, Thermal model in digital twin of vertical PV system helps to explain unexpected yield gains, EPJ Photovolt. 14, 32 (2023). https://doi.org/10.1051/epjpv/2023027 [Google Scholar]
- ENTSO-E. Day Ahead Price [Data set]. ENTSO-E Transparency Platform (2025). Retrieved from Transparency Platform on 16 January 2025. [Google Scholar]
- CBS, Statistics Netherlands. Hernieuwbare elektriciteit; productie en vermogen [Dataset]. StatLine, Centraal Bureau voor de Statistiek (2025). Last updated 18 July 2025. StatLine - Hernieuwbare elektriciteit; productie en vermogen [Google Scholar]
- J. Good, J.X. Johnson, Impact of inverter loading ratio on solar photovoltaic system performance, Appl. Energy 177, 475 (2016). https://doi.org/10.1016/j.apenergy.2016.05.134 [Google Scholar]
- B.B. Van Aken, A. Binani, E. Barros, A.R. Burgers, F. Van der Zee, A. Schotman, K. Cesar, Ground irradiance modelling: of key importance for designing nature-inclusive solar parks and agrivoltaic systems, in Proc. EU PVSEC (2021), p. 1596. https://doi.org/10.4229/EUPVSEC20212021-6CV.4.42 [Google Scholar]
- I. Cesar, B.B. Van Aken, Evaluation method and module design for cost-effective compliance with irradiance guidelines to maintain soil quality in solar parks, EPJ Photovolt. 16, 13 (2025). https://doi.org/10.1051/epjpv/2025003 [Google Scholar]
Cite this article as: Bas B. Van Aken, Ilkay Cesar, Differences between economical, ecological and societal optimal designs of solar parks due to feed-in restrictions, EPJ Photovoltaics 17, 10 (2026), https://doi.org/10.1051/epjpv/2026003
All Tables
All Figures
|
Fig. 1 Specific yield in kWh/kWp as function of the ground coverage ratio and the tilt angle of the PV arrays. (Left) assuming a 100% AC:DC ratio, (right) assuming a 50% AC:DC ratio. |
| In the text | |
|
Fig. 2 Energy yield density in kWh/m2 as function of the ground coverage ratio and tilt angle of PV arrays. The AC:DC ratio used in the calculations was 100% (left) and 50% (right). |
| In the text | |
|
Fig. 3 Levelised cost of electricity, LCoE as function of ground coverage ratio, GCR, and tilt angle. Note that the contour lines are not at constant distance: up to 68 Euro/MWh, the intervals are 2 Euro/MWh, above 68 Euro/MWh the intervals are 4 Euro/MWh. (Left) full grid connection, (right) grid connection restricted to 50% of nominal DC power. |
| In the text | |
|
Fig. 4 (Top) cross-sections through four solar park designs, (bottom) corresponding ground irradiances. |
| In the text | |
|
Fig. 5 (left) Cumulative generated energy on the vertical axis as function of the relative DC power on the horizontal axis. (right) Relative energy remaining after applying the AC:DC ratio on the horizontal axis. |
| In the text | |
|
Fig. 6 (Left) LCoE and (right) capture price as function of the AC:DC ratio. Note that the LCoE is a discounted value over the lifetime of the solar park, whereas the capture price is the real income over a particular year. |
| In the text | |
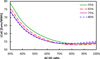 |
Fig. 7 Same as Figure 6, left, but excluding land lease costs. |
| In the text | |
|
Fig. 8 Total energy yield of PV with BESS as function of the storage size, expressed in hours at 50% DC capacity, for the solar park design with 55% GCR, full red circles, and the design with 80% GCR, open blue triangles. |
| In the text | |
Current usage metrics show cumulative count of Article Views (full-text article views including HTML views, PDF and ePub downloads, according to the available data) and Abstracts Views on Vision4Press platform.
Data correspond to usage on the plateform after 2015. The current usage metrics is available 48-96 hours after online publication and is updated daily on week days.
Initial download of the metrics may take a while.