| Issue |
EPJ Photovolt.
Volume 16, 2025
Special Issue on ‘EU PVSEC 2024: State of the Art and Developments in Photovoltaics’, edited by Robert Kenny and Gabriele Eder
|
|
|---|---|---|
| Article Number | 24 | |
| Number of page(s) | 11 | |
| DOI | https://doi.org/10.1051/epjpv/2025013 | |
| Published online | 20 May 2025 | |
https://doi.org/10.1051/epjpv/2025013
Original Article
Decoding pixels: A modular software prototype for cognitive image-based diagnostics of PV plants
CEA, Liten, Univ. Grenoble Alpes Campus INES, 73375 Le Bourget du Lac, France
* e-mail: This email address is being protected from spambots. You need JavaScript enabled to view it.
Received:
23
August
2024
Accepted:
10
April
2025
Published online: 20 May 2025
Abstract
Although aerial infrared (aIRT) imagery-based solutions for diagnostics of PV plants demonstrate impressive time-efficiency and spatial resolution, they also suffer from considerable drawbacks: limited automation (hence, expert dependence) and insufficient quantitative insights. In this paper, we introduce a software prototype, evolved from an innovative diagnostics framework researched and developed by CEA-INES over the last years, which integrates aIRT imagery with deep learning-based algorithms and physical/electrical modeling. With such an approach, unlike conventional ones, we worked on reaching both qualitative fault detection and quantitative (power loss) insights, with a focus on various spatial granularity levels within PV systems. Leveraging advanced deep learning techniques, first results show that we can achieve automated PV module detection and fault identification/classification, with associated power loss analysis at PV system, string/inverter, or module level. Further real-life validation efforts are underway, in utility-scale PV plants. Future developments aim to enhance further enhance our PV diagnostic framework, through data fusion with SCADA outputs and integration with maintenance and end-of-life (EoL) management tools.
Key words: PV systems / fault diagnostics / deep learning / thermal imagery
© J.I.A. Tsanakas and P. Marechal, Published by EDP Sciences, 2025
 This is an Open Access article distributed under the terms of the Creative Commons Attribution License (https://creativecommons.org/licenses/by/4.0), which permits unrestricted use, distribution, and reproduction in any medium, provided the original work is properly cited.
1 Rationale and aim
To date, monitoring-based detection and assessment of underperforming photovoltaic (PV) plants are typically executed in a semi-manual top-down approach, analysing low-performing components or failures (e.g., in PV modules), by drilling down from substations, inverters to strings and junction boxes [1]. Particularly for utility-scale PV systems, which can exceed hundreds of thousands of PV modules, monitoring-based diagnostic needs can be significantly complex and demanding.
Relying solely on PV monitoring data, has two significant intrinsic limitations: i) expert dependence (e.g., misconfigured reference performance data or misinterpreted deviations) and ii) insufficient spatial granularity. As a result, for several underperformance issues and failures − especially on PV module and submodule level − they may either remain undetected, trigger false alarms or their root-cause stays unidentified. On this basis, the need for advanced diagnostics, e.g., at higher spatial granularity, is typically addressed today through additional data streams, e.g., from advanced PV inspections, notably aerial infrared thermographic (aIRT) imagery.
Vidal de Oliveira et al. [2] conducted a study on unmanned aerial vehicle (UAV) based aIRT inspections of PV power plants in Brazil, effectively detecting faults such as hotspots, disconnected modules, and defective cells. The study demonstrated that UAV-mounted infrared imaging significantly outperforms traditional IR imagery approaches in terms of speed and efficiency while reducing human error. Manno et al. [3] explored the use of convolutional neural networks (CNNs) for automatic thermographic image classification. By applying pre-processing techniques such as normalisation, greyscaling, and wavelet transformation, the method achieved a classification accuracy of 99 per cent on a dataset of 1,000 images. Furthermore, UAV-based thermography was found to be 5 per cent more accurate than ground-based inspections, reinforcing the potential of AI-driven fault detection in PV systems. Herraiz et al. [4] proposed integrating UAV-mounted thermal cameras with region-based CNNs (ReCNN) for automated PV plant condition monitoring. The model successfully detected panel anomalies, mapped their locations, and provided maintenance recommendations. The method proved to be highly effective in reducing operational costs and increasing the efficiency of large-scale PV inspections. Kandeal et al. [5] presented a similar UAV-based aIRT inspection approach for PV system diagnostics, in which they demonstrated that AI-enhanced image processing, such as CNN-based classification, further improves fault detection efficiency. In [6], Di Tommaso et al. proposed a novel multi-stage model based on YOLOv3 for automatic defect detection in PV modules using IR and visible (VIS) imaging captured by UAVs. The model aimed to improve the accuracy and efficiency of PV plant inspections, enabling predictive maintenance and minimising downtime. Key results included outstanding PV module detection accuracy in terms of « average precision (AP) », e.g., AP@0.5 exceeding 98 per cent, effective hotspot detection (AP@0.4 of 88.3 per cent), and the ability to identify various faults and mismatches like soiling, delamination, and bird droppings. The model is also claimed to predict hotspot severity and soiling coverage, providing actionable insights for maintenance.
Although aIRT imagery data analytics demonstrate impressive time-efficiency and spatial resolution (inspection rates of several MW/hour; fault detection and classification down to submodule/cell level), they also suffer from considerable limitations. On one hand, image-based fault detection features (still) currently lacks sufficient automation, thus remaining highly expert-dependent and prone to false negatives and/or positives. On the other hand, they remain decoupled from PV monitoring, barely correlated with e.g., real-time performance data. Thus, they only provide a rather qualitative instantaneous assessment, with practically non-existent temporal granularity, than a complete diagnosis with quantitative root-cause analysis [1].
Over the last seven years, CEA-INES has built an innovative (and continuously evolving) diagnostics framework for PV plants, based on a patented methodology that leverages aIRT imagery, coupled with physical/electrical modelling [7–9]. As input data, typically, the diagnostic framework leverages UAV-based aerial orthophoto thermal maps, to detect, diagnose, and classify faults in large-scale PV plants [10], along with auxiliary monitoring data and ground-based visual inspection. In addition, a patented physics-based methodology, based on simplified energy-balance modelling, provides quantitative insights of different diagnosed faults, in terms of associated power losses [8]. What differentiates today such methodology from the state-of-the-art, is exactly the fact that it is made to provide not only qualitative fault diagnosis, but also primary quantitative insights for different PV failures, at different spatial granularity levels, e.g., from PV system and inverter/string level, down to module and submodule level. Although several high-impact publications and ongoing research, development and innovation programs demonstrate the scientific and industry relevance of such approach, there is still much room for further development and improvement:
Need for more precise qualification and root-cause analysis features for PV faults, thus minimising false negatives/positives, e.g., by correlation with SCADA (supervisory control and data acquisition) outputs or employment of multi-stream data fusion.
Need for more accurate power loss analysis (beyond today's approximately 80- 90 per cent demonstrated accuracy) and complete diagnosis, again by leveraging data fusion from multiple streams (e.g., monitoring, imagery).
Need for higher time-efficiency, thus automation in recognition/analysis and classification of PV module and failure signatures, in diverse PV plant configurations.
In the context of the EU-funded H2020 project SERENDI-PV [11], we have evolved the aforementioned diagnostic framework in the form of “ASPIRE”, a software prototype [12]. ASPIRE has been primarily programmed in Matlab and currently runs through MatLab / Windows for its compiled/distributable version, but could be used on any MatLab-compatible operating system (OS), if executed from the source code. For its use, no specific or specialized additional hardware is needed, apart from a standard desktop computer or laptop. Typical computational (process) times, can range from 15 seconds (for the case of analysis of few PV arrays) to 3–5 minutes or more, for the case of processing and diagnosis hundreds of PV arrays within a utility-scale PV plant.
Considering the above three needs, our efforts − at this stage − have focused on implementing a deep learning-based approach for fully automated recognition of PV modules and their failure signatures, along with enhanced precision for the qualification and analysis of PV failures. A final intended feature, e.g., the correlation/fusion with SCADA data, is currently under exploration. In this paper, we present the main elements of our approach, the software prototype functionalities and example results from one of our initial validation case studies, as well as from a completed real-life demonstration in a utility-scale PV plant.
2 Methodology
2.1 Deep Learning approaches used and training database
The automated detection and recognition feature of ASPIRE has been based on coupling two established deep learning (DL) approaches (Fig. 1): i) the real-time object detection pipeline YOLO (You Only Look Once) and ii) the Mask Region-based Convolutional Neural Network (Mask R-CNN). The former approach yields higher sensitivity to detection, while the latter is provides detailed information about the shape and pattern (of the aIRT signatures, in our case).
YOLO is a real-time object detection algorithm that is highly effective in detecting PV modules in aIRT images. It is used as the first-stage detector to quickly identify and localize PV modules in an image. Mask R-CNN is a segmentation algorithm that provides pixel-wise masks of detected objects. It is applied in a second stage to refine the precise boundaries of the detected PV modules. The coupling follows a two-step pipeline:
YOLO detects module locations quickly with bounding boxes (coarse detection).
Mask R-CNN refines the segmentation by applying instance segmentation within the identified regions, reducing false detections and improving precision.
This approach improves the accuracy of PV module recognition, especially in dense or overlapping module layouts, where single-method approaches struggle.
For the training of the coupled algorithms, we have implemented and employed a database of anonymized real-world aIRT images of PV installations (Fig. 2-left). Such images were intentionally chosen to include diverse PV layouts and conditions (e.g., in terms of size, tilt, brightness) and interfering objects (e.g., roofs, cars, substations, trees/vegetation, chimneys, etc), in order to maximise
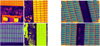 |
Fig. 2 Left: Example aIRT images of diverse features, employed in the database for auto-detection training. Right: Example outputs from initial auto-detection tests on aIRT images. |
 |
Fig. 1 Example architecture of the real-time object detection pipeline YOLO (on the left) and Mask R-CNN (on the right) algorithms [13–16]. |
2.2 Implementation steps − Training/test parameters and initial outputs
The overall auto-detection function in ASPIRE, has been implemented in four main steps: i) the algorithm implementation and pre-training, ii) the transfer learning, iii) the training/test database and parameterisation and iv) the detection test outputs (validation) and loop-learning. The Mask R-CNN algorithm's backbone is a residual network (ResNet), with 50 convolution layers, which skips some layers during training to avoid the vanishing gradient problem and to optimise the learning. For the training of our neural network we were inspired by a study of Bommes et al. [17] and we used a Mask R-CNN pre-trained on a COCO (Common Objects in Context) database. Following the algorithm implementation and its pre-training, we have applied transfer learning, for which − in our case study − we have two classes: the PV modules and the background. Therefore, to train our network in recognising these two classes, our transfer learning is applied on the last two ResNet layers; thus, in turn, the training adapts the weights to our database on its last layers. Transfer learning is applied in our approach to leverage pre-trained deep learning models, such as Mask R-CNN trained on the COCO dataset, and adapt them to our specific problem of PV module and fault detection. This technique significantly reduces the need for extensive labeled datasets and computational resources while improving model performance. By re-training only the final layers of the network on our dataset, we ensure that the model learns to recognize PV modules and anomalies with greater precision. This approach enhances automation and accuracy in diagnostics, addressing the expert-dependence issue in aerial infrared imagery analysis.
Next to the transfer learning, we have employed the database described in Subsection 2.1, to train and further optimise and tune the auto-detection algorithm for ASPIRE. The Mask R-CNN was trained with 2048 images, whereas a test set consists of 256 images. The training is carried out with a batch of size 2 (e.g., the update of the coefficients of the network is done every 2 images). We perform 30 epochs (e.g., the data set is seen 30 times by the network) and a learning rate adjusted after each epoch at initial initial learning rate of 0.001 (e.g., no advancement in the gradient). Finally, the optimisation method applied in our case is the SGDM (stochastic gradient descent with momentum). From the outputs of the initial detection tests that we performed, we observe that, while the detection of PV module objects is correctly learned by the Mask R-CNN and false detections are avoided, the PV module masks lack precision as they do not always follow the exact PV module edges and outline (Fig. 2-right). Further training, optimisation and coupling with the YOLO algorithm allowed us to improve the precision of our auto-detection feature, eventually included in the ASPIRE.
For assessing and further improving YOLO's performance, the algorithm − trained on the aforementioned dataset of 2048 aIRT images − was fine-tuned with custom anchor boxes to better detect PV modules. A mean Average Precision (mAP) of 98.2 per cent was achieved, at intersection over union (IoU) of 0.5, ensuring robust module localisation. For the Mask R-CNN, its performance was fine-tuned on the same dataset using ResNet-50 as backbone with ROI Align for improved feature extraction, trained with the aforementioned adjusted hyperparameters. In such way, we achieved a 94.7 per cent mask accuracy in defining PV module edges, reducing false detections.
The combination of YOLO and Mask R-CNN ensures both speed and accuracy, which is crucial for processing large-scale PV plants through ASPIRE. The approach significantly improves module detection in complex backgrounds, reducing errors caused by reflections, occlusions, or misalignments in aerial imagery. It enhances module-level diagnostics by ensuring each PV module is correctly segmented before fault analysis.
More precisely, the overall performance gains from coupling these two algorithms include: i) Reduction of false positives by 23.4 per cent compared to YOLO alone; ii) Improved segmentation precision (better contour matching) by 19.1 per cent compared to Mask R-CNN alone; iii) Faster inference time compared to using Mask R-CNN independently (since YOLO reduces search space for segmentation).
2.3 Qualification and loss analysis of PV failures
The second feature integrated in the ASPIRE software prototype refers to the precise image-based qualification (or classification) of PV modules detected with failures, along with the calculation of the associated power losses under operating conditions. The main principles of the classification approach and the loss analysis methodology have already been introduced and detailed in previous publications [8,9,18], as well as in a published patent [8] respectively.
The fault classification and qualification features are based on detection masks applied to the thermal image signatures of PV faults. The approach combines expert-assisted diagnosis (encompassing theoretical/empirical models, statistical analysis and predefined fault libraries) and pattern recognition algorithms. Detection masks work by segmenting and analyzing thermal images to identify characteristic patterns that correspond to specific PV failures (e.g., hotspots, bypass diode failures or open circuits). They are applied to the pixel-level thermal signature of each PV module, allowing the system to classify faults based on temperature deviations and spatial distribution. On this basis then, ASPIRE performs fault classification through a so-called defect checker. The latter serves as an analysis module that compares detected thermal anomalies against a reference fault database, ensuring accurate classification. This process involves automated feature extraction, pattern matching, and expert-set thresholds. The approach is particularly useful in minimising false positives and negatives and improving fault root-cause identification. Example results of the application of detection masks and the “defect checker” dashboard is given in Section 3.3.
On the other hand, the loss analysis feature is based on patented method and system for diagnosing faults in PV modules and estimating the corresponding energy losses using aIRT imagery. The approach leverages IR image processing to detect defects such as hotspots, bypass diode failures, and open circuits, providing then quantitative power loss estimates for affected modules. In brief, the patented method comprises the steps described in [8]:
Acquisition of a thermal image of the defective PV module during operation;
Splitting of the thermal image acquired into various temperatures zones and determination of the respective temperatures relating to the various zones on the basis of the thermal image;
Obtaining a reference temperature (Tref), e.g., the operat- ing temperature of a reference (“healthy”) PV module;
Detection, from among said temperature zones, of at least one hot zone whose temperature is greater than the Tref with a temperature deviation of greater than or equal to a predefined minimum value (Tmin);
Calculation of the (estimated) loss of PV power output of the module on the basis of energy-balance modeling principles [19], e.g., using as main inputs the temperature deviation between the temperature of the hot zone and the Tref, of the surface area of the hot zone and a thermal exchange co-efficient of the module [8].
The resulting output provides quantitative power loss estimates (in per cent), allowing operators to assess the severity of the fault and prioritize maintenance actions. The method can be (optionally) combined with SCADA data to improve diagnostic accuracy, spatiotemporal resolution and provide long-term PV faults' tracking.
3 Results and discussion
The developed version of ASPIRE prototype has three functional blocks: i) Auto-detection of PV modules and anomalies (e.g., potential failures), ii) Classification and estimation of power losses and iii) complete analysis dashboard, with primary qualitative and quantitative insights. It should be clarified that anomalies are detected as hot zones in IR images, though in a broader context (e.g., RGB–IR fusion), other anomalies such as soiling may not appear as hot zone, but are still considered as faults/anomalies to be diagnosed.
In the following sub-sections we give an overview of representative (example) results for each function.
3.1 Results on the auto-detection feature
At its base, the software's algorithm auto-detects PV modules and anomalies, from image and/or radiometric data, using segmentation, based on the determination of the PV module edges. In real-world complex cases of overlapping PV arrays or complex scenes, this method alone cannot auto-detect all PV modules separately; that is why we have recently developed and applied instance segmentation based on the coupled DL approach presented in Section 2. In Figure 3, we present an example of the resulting workflow in ASPIRE, starting from raw aerial infrared and visual (red-green-blue, RGB) images (Fig. 3A and B). The aIRT and RGB images are combined by image fusion. The fused image (Fig. 3C) is post-treated to improve contrast and reduce parasitic elements, to then undergo automatic adaptive thresholding (CEA patent pending), for auto-segmentation, to automatically detect the PV modules (Fig. 3D). From the latter, outlier features are extracted for anomalies (potential faults) detection (Fig. 3E). Fault detection in ASPIRE is implemented on two levels: PV module and PV plant. The sub-Section that follows discusses further on the faults' analysis. It should be clarified that, with auto-segmentation, we refer exclusively to modules detection in an image, whereas auto-detection is a more generic term which can apply to both modules detection in an image or even to fault detection in a module (through the image).
To ensure that anomalies detected in overlapping aIRT images are not counted multiple times, ASPIRE integrates module localisation techniques based on image fusion (aIRT and RGB) and geo-referencing. The groundwork of such approach was first introduced in [7]. As such, each PV module is uniquely identified within the plant layout, allowing the software to cross-check detections across multiple images and consolidate anomaly reports. This approach prevents redundancy and enhances diagnostic reliability.
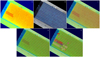 |
Fig. 3 Example raw aIRT (A) and aerial RGB (B) images imported and fused (C) in ASPIRE; (D) Detection of PV modules, from the fused aIRT–RGB image, using auto-segmentation; (E) Auto-detection of anomalies in a fused aIRT/RGB image (example case of open-circuited modules or strings). |
3.2 Results on the classification and loss analysis feature
At PV module level, ASPIRE looks for faults such as hot spots, failed (e.g., shunted) bypass diodes, junction box failures, potential induced degradation (PID), as well short- or open- circuited PV modules and submodules. We have created signature (detection) masks for each fault that we apply to the pixels that correspond to the PV module's IR signature. Using expert-set thresholds, the algorithm predicts whether there is a fault (or faults) and specifies its type (classification). At PV plant level, the diagnosis takes into account the electrical architecture of the PV plant, e.g., the physical and electrical layout of inverters and strings. When, for instance, open-circuited PV modules are detected on the same string, automatically all modules of the string are displayed as disconnected as well.
Next to the detection and classification steps, the power loss analysis feature is based on the application of the pixel-level temperature (radiometric) data of the PV modules (in particular, the delta temperature (ΔT) between normal and fault pixels) to CEA's physics model-based methodology [8]. For the visualisation of the power loss analysis, ASPIRE creates hollow matrices (Fig. 4) of “healthy” (fault-free) and faulty PV modules, using a smoothing algorithm. For each faulty PV module, a colour delta (hence, ΔT), e.g., between the PV module's healthy and faulty state, is then associated to a calculated power loss (in per cent) at PV module, string or system level.
Such matrix format shown in the examples of Figure 4 is a grid-based representation of the PV system, where each element corresponds to a detected PV module in the aIRT images. Healthy module temperatures are not uniform because slight variations in operational conditions (e.g., shading, inverter efficiency, temperature gradients) naturally cause modules in the same string to have small differences in temperature. On this basis, our tool estimates expected module temperatures based on adjacent module data, historical records, and standard reference values for PV operation. The observed temperature distribution pattern follows physical and electrical constraints of the PV plant. In particular, string-level electrical interconnections influence how faults and power losses propagate across the studied PV array or string(s). The software then applies a smoothing algorithm to account for small temperature variations, preventing abrupt changes caused by imaging noise.
The hollow matrix feature is primarily used for facilitating:
Fault visualisation − Clearly distinguishing faulty modules from healthy ones.
Power loss estimation − Quantifying the impact of faults at module, string, and system levels.
Operational decision-making − Assisting O&M teams in prioritising maintenance efforts.
 |
Fig. 4 Initial (raw) hollow matrix of PV modules from an aIRT image, in ASPIRE (A). Hollow matrix with corrected PV modules in fault-free mode (B). Final hollow matrix for power loss calculation/analysis in ASPIRE (C). |
3.3 Results on complete analysis dashboard
The last functional block of ASPIRE is a dashboard for overview and analysis of a PV plant's condition, It integrates insights from the auto-detection, fault classification and power loss analysis features. Figure 5A presents the results from an aIRT inspection case study on a test PV site (e.g., with controlled PV faults). The complete analysis dashboard shown in this case includes the mapping of PV modules and failures (power loss and hollow matrix), the fault-specific percentage of power output losses for the different diagnosed/classified failure modes (“defect classes”) in the inspected PV plant, as well as power production and loss data at string level, when information on the electrical layout is available. In the presented example, the majority of diagnosed faults are associated as disconnected strings, whereas few cases of hot spots, bypass diode or junction box failures are also identified. The loss analysis at string production level is suggestive of such faults, with losses ranging from 1 to 1.5 per cent for failures of low/moderate severity (e.g., individual hot spots) up to 20 to 30 per cent, for open-circuited strings or array level failures. Further, it is also possible to carry out a focused diagnostic study at PV module level, down to submodule and cell level.
Figure 6 shows an example of such dashboard for targeted analysis, at PV module level, for the case of a diagnosed PID (flagged as “multi-hotspot”). Distinguishing PID from similar thermal patterns (multi-hotspots or shading and soiling) can be challenging, sometimes leading to correct detection but incorrect fault classification. Misclassifying PID as a multi-hotspot (or vice versa) can also reduce the accuracy of power loss estimates. In the current version of ASPIRE, which primarily relies on thermal patterns, abnormal heating near module frames and towards the end of PV strings is flagged as PID, while other multi-hotspot cases are classified separately. A future version incorporating multispectral imaging in ASPIRE (see also Sect. 5) will improve differentiation of such patterns.
In another example of targeted analysis at PV module level, Figure 7-left shows the function of ASPIRE's ‘defect checker’ (based on detection masks) feature and how the latter is used to confirm a bypass diode failure: i) comparing with and excluding thermal patterns of other PV failure modes and ii) implementing a submodule-level analysis to pinpoint the location of the failed component, bypass diode 1 (left one) in this case. Then, Figure 7-right displays the overall analysis dashboard for the PV module impacted from the bypass diode failure. It should be noted that, as also explained in Section 2.3, a detection mask is a mask used to process and compare different parts of a module's temperature map. Different masks target specific failures, such as bypass-diode failure mask, PID mask, etc. On the other hand, the defect-checker tool refers to a given analysis module in ASPIRE's processing flow, as used and discussed in this step and the examples of Figures 6 and 7.
Overall evaluation of ASPIRE's acquired results, against actual PV data, indicates that ASPIRE's outputs are generally coherent (losses ranging from 0 to 100 per cent) and consistent with deterministic models of (known) losses, such as open-circuits or bypass diode failures. Results from global power loss validation show an approximate 1 per cent to 3 per cent mean overestimation of the actual power production compared to the inverter and I-V data for the studied test site. In terms of diagnostic accuracy, for the test PV site, ASPIRE has (so far) correctly diagnosed approximately 89 per cent of the anomalies, whereas approximately 9.7 per cent of diagnosed cases were false negatives and approximately 1.7 per cent false positives. These insights are also summarized through the confusion matrix of Figure 5B.
It should be noted that, most of the identfied case of false positives, can be (so far) explained from the fact that ASPIRE does not crosslink RGB (visual spectrum) and IR spectrum data to detect or classify certain faults like shading or soiling. It rather “sees” the result (as hot spot) of soiling or shading cases, if these are leading to severe mismatch effects. In a future version, as we discuss in Section 5, we intend already to include not only RGB info but also other spectra, to exactly extend its diagnostic/classification capacity and minimize false positives.
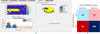 |
Fig. 5 A: ASPIRE's insights and analysis dashboard for an example aIRT inspection case in a test PV site. B: Overall confusion matrix for the diagnostic study of the same test PV site. |
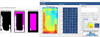 |
Fig. 6 PV module-level dashboard; example of a defect checker and diagnostic analysis for the case of a PID. |
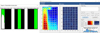 |
Fig. 7 Left: ASPIRE's “defect checker” feature at PV module level, for the case of a bypass diode failure (Diode 1, left). Right: Output generated in the PV module-level dashboard, for the full analysis of the identified bypass diode failure. |
4 Further discussion − Return of Experience (REX) and challenges encountered
In the framework of SERENDI-PV, a real-life demonstration campaign of ASPIRE is underway, in the form of targeted aIRT inspections of several operating strings of bifacial half-cut PV modules, in a 62 MW utility-scale PV plant, with single-axis tracking, located in northeastern Spain. As in Sections 3.1–3.3, the functionalities of ASPIRE were “crash-tested” with a completely new type/format of data set, as compared to the PV test-site study. In the next paragraphs, we discuss some first indicative results from this campaign.
Figure 8 shows the process, from the auto-segmentation (auto-detection) step to the selection of a group of PV modules identified for further diagnostic analysis. This group was labelled by the tool as ‘G1–R1–C1’. In such example, G1-R1-C1 is an (arbitrary) name given to the studied group of PV modules and derives from the identification terms “Group 1” − “Row 1” − “Column 1”. In this case, only a few manual corrections were needed to adjust the auto-segmentation results (e.g., edge adjustment of the yellow-highlighted PV module in the upper string). Next, a detailed diagnostic analysis of G1-R1-C1 is performed, as displayed in Figure 9. In this case, ASPIRE was able to detect and analyse a “multi-hotspot” type fault at PV module level as shown at the right window of Figure 9; whereas the rest of the adjacent PV modules in the group have been flagged as faultless. This result is consistent with both on-site validation (ground inspections and IV tracing) and with the analysis of the monitoring/imagery data at string level via commercial tools.
Another example of successful detection and classification of fault detection and classification by ASPIRE is shown in Figure 10, in which a bypass diode failure is auto-detected for PV module labelled as ‘G1–R1–CR1–C3’ (Fig. 10, left) and diagnosed through the analysis of the thermal map and ‘defect checker’ function (Fig. 10, right).
Although several other cases of occurring faults have been detected and fully diagnosed, the overall auto-detection performance of the ASPIRE tool has been significantly declined in the real-life demonstration campaign, compared to the test-site study, with over 20 per cent rate of false negatives and positives, to date. This is mainly due to the (unforeseen) incompatibility between the format of the data optimally treated by ASPIRE (e.g., orthophoto georeferenced radiometric images) and the output data (raw radiometric images) from the inspection campaign, provided from the corresponding service provider (contractor of the SERENDI-PV partner, owner of the PV plant). To overcome functionality issues related to such data incompatibility, some of ASPIRE's algorithms were limited in scope; as a result, certain analysis features such as auto-detection and defect checking/classification were heavily impacted in terms of user-dependence and diagnostic sensitivity.
For example, as shown in in Figure 11, after launching the detailed thermal analysis on eleven auto-segmented PV modules (G1-R1-C1) from a specific string, ASPIRE fails to flag the abnormal thermal patterns of two PV modules, although both being confirmed in open-circuit condition, as confirmed with ground inspection.
Such examples of less successful results, in this specific case, indicate that there is still much room for further improvement and training of the employed algorithms and models in ASPIRE; whereas highlighting the importance of high quality data (as in the case of monitoring data) and their impact on diagnostics' accuracy, as well as the need − in some cases − of cross validation with complementary diagnostic data.
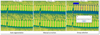 |
Fig. 8 Group selection of PV modules for further diagnostic analysis (right), following initial auto-detection (left) and manual correction (middle) steps, (left), (middle), (right) (‘G1–R1–C1’) of the studied 62 MW PV plant demonstration. |
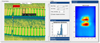 |
Fig. 9 Detailed diagnostic analysis of G1-R1-C1, revealing a PV module with multiple hot spots. |
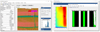 |
Fig. 10 Left: Segmentation and detection of a PV module (‘G1–R1–CR1–C3’) suspected with bypass diode failure. Right: Thermal map analysis and ‘defect checker’ (detection mask) feature at PV module level, for the case of a bypass diode failure (Diode 3, right). |
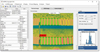 |
Fig. 11 Example of unsuccessful diagnosis, where two open-circuited PV modules (abnormal thermal patterns in G1-R1-C1) were overlooked and not flagged by ASPIRE as failures, whereas others (two modules at top right) are erroneously flagged (false positives). |
5 Conclusions − Future work
In this paper, we introduce ASPIRE, a software prototype for complete fault diagnostics in operating PV plants, evolved from an innovative diagnostics framework researched and developed by CEA-INES over the last years, which integrates aIRT imagery with deep learning-based algorithms and physical/electrical modeling. The developed approach, unlike conventional ones, enables both qualitative fault detection and quantitative (power loss) insights, at various levels of spatial granularity within PV systems. First results, mainly on a PV test site (with controlled or known fault scenarios), confirm ASPIRE's capacity to achieve automated PV module detection and fault identification/classification, with associated power loss analysis at PV system, string/inverter or module level. In particular, ASPIRE has (so far) correctly diagnosed approximately 89 per cent of the anomalies, whereas approximately9.7 per cent of diagnosed cases were false negatives and approximately 1.7 per cent false positives; whereas, global power loss validation shows an approximate 1 per cent to 3 per cent mean overestimation of the actual power production compared to the inverter and I-V data for the studied test site.
In a real-life (utility-scale PV plant) setting, first results and REX from an ongoing demonstration indicate that there is still much room for research and improvement. Although most of the occurring faults have been detected and fully diagnosed, the overall auto-detection capacity and diagnostic accuracy of ASPIRE has been significantly decreased in the case of real-life demonstration, compared to the test-site study, with over 20 per cent rate of false negatives and positives. This is mainly due to the (unforeseen) incompatibility between the format of the output data (raw radiometric images) provided from the inspection campaign and the one optimally treated by ASPIRE (e.g., orthophoto- georeferenced radiometric images). There is ongoing development, focusing on extensive re-architecturing of ASPIRE, in the framework of the ongoing Horizon Europe SUPERNOVA project. This is in order to both address such issues discussed in Section 4 and also to render the tool more interoperable with other monitoring and maintenance tools onsite. We expect to be able to present a new version in a 12–15 month timeframe, also according to SUPERNOVA's timeline related to this objective.
Apart from the witnessed challenges related to data standardisation and compatibility, as solar cells/PV technologies shift (e.g., half-cut cells, bifacial PV, TOPCon cells, etc.) and new PV applications emerge (floating PV, agrivoltaics), we may encounter new failure modes and thermal signatures, specific to these technologies and applications. In this context, we anticipate a need for updating existing fault classification matrices [19,20], that often provide the theoretical basis and substantial expert-based decisions for both commercial tools and for the case of ASPIRE.
All things considered, although results are considerably promising, for both initially set objectives, e.g., higher time-efficiency (through the DL-driven automated detection) and higher accuracy in fault classification/loss analysis, we are currently working on further validating, evolving and improving this software prototype, on three future goals:
Correlation and fusion with other data streams, to minimize false negatives and (most importantly) maximize the spatiotemporal granularity and accuracy of the PV faults diagnosis.
Interoperability with on-site automated maintenance tools, to streamline (data-driven) corrective maintenance interventions, such as robot-assisted cleaning (soiling mitigation) and vegetation management.
PV module “qualification” feature, to be introduced and streamlined for prepare-for-repair or reuse operations, leveraging from multispectral imagery datasets.
Since early 2024, the collaborative platform COPLASIMON [21], developed and launched in the context of SERENDI-PV project, provides an example step-by-step demonstration user guide video of ASPIRE [22], publicly accessible for researchers and readers further interested in being introduced to the tool's functionalities.
Acknowledgments
The authors would like to acknowledge the invaluable contribution of former colleagues Dr. Duy-Long Ha and Mrs. Murielle Stepec, in the conception, groundwork and development of ASPIRE. Part of this work has been carried out in the framework of the H2020 SERENDI-PV project and the Horizon Europe. The authors would also like to acknowledge the contribution of SERENDI-PV partners from Galp Energia, with special thanks to Mrs. Filipa Monteiro Martins and Mr. Jorge Veludo.
Funding
Part of this work has been carried out in the framework of the H2020 SERENDI-PV project and the Horizon Europe (Fig. 11). Example of unsuccessful diagnosis, where two open-circuited PV modules (abnormal thermal patterns in G1-R1-C1) were overlooked and not flagged by ASPIRE as failures, whereas others (two modules at top right) are erroneously flagged (false positives). 10 J.A. Tsanakas and P. Marechal: EPJ Photovoltaics Vol, No (2025) SUPERNOVA project. SERENDI-PV project has received funding from the European Union’s Horizon 2020 research and innovation programme under grant agreement No. 953016. SUPERNOVA has received funding from the European Union’s Horizon Europe research and innovation programme under grant agreement No 101146883. Part of this work was also supported by the French National Program “Programme d’Investissements d’Avenir INES.2S” under Grant Agreement ANR ANR-10- IEED-0014 0014-01.
Conflicts of interest
The authors have no conflicts of interest to disclose.
Data availability statement
Raw (source) data associated with this article cannot be disclosed, due to commercial/legal restrictions.
Author contribution statement
Conceptualisation: J.A. Tsanakas; Methodology and Software: P. Marechal; Validation, Formal Analysis and Data Curation: P. Marechal and J.A. Tsanakas; Resources, Supervision, Project Administration and Funding Acquisition: J.A. Tsanakas; Writing (Original Draft Preparation): J.A. Tsanakas and P. Marechal; Review and Editing: J.A. Tsanakas.
References
- SolarPower Europe, Operation & Maintenance: Best practice guidelines Version 5.0 (SolarPower Europe, 2021) [Google Scholar]
- A.K. Vidal de Oliveira, M. Aghaei, R. Rüther, Aerial infrared thermography for low-cost and fast fault detection in utility-scale PV power plants, Sol. Energy 211, 712 (2020) [CrossRef] [Google Scholar]
- D. Manno, G. Cipriani, G. Giulla et al., Deep learning strategies for automatic fault diagnosis in photovoltaic systems by thermographic images, Energy Convers. Manag. 241, 114315 (2021) [CrossRef] [Google Scholar]
- A.H. Herraiz, A.P. Marugan, F.P. Garcia Marquez, Photovoltaic plant condition monitoring using thermal images analysis by convolutional neural network-based structure, Renew. Energy 153, 334 (2020) [CrossRef] [Google Scholar]
- A.W. Kandeal, M.R. Elkadeem, A.K. Thakur et al., Infrared thermography-based condition monitoring of solar photovoltaic systems: A mini review of recent advances, Sol. Energy 223, 33 (2021) [CrossRef] [Google Scholar]
- A. Di Tommaso, A. Betti, G. Fontanelli et al., A multi-stage model based on YOLOv3 for defect detection in PV panels based on IR and visible imaging by unmanned aerial vehicle, Renew. Energy 193, 941 (2022) [CrossRef] [Google Scholar]
- J.A. Tsanakas, L.-D. Ha, F. Al Shakarchi, Advanced inspection of photovoltaic installations by aerial triangulation and terrestrial georeferencing of thermal/visual imagery, Renew. Energy 102, 224 (2017) [CrossRef] [Google Scholar]
- D.-L. Ha, J.A. Tsanakas, Patent No. WO2016189052/A1 (International), FR3036900 (France), CEA [Google Scholar]
- U. Jahn, M. Herz, M. Köntges et al., Report IEA-PVPS T13-10: 2018 [Google Scholar]
- J.A. Tsanakas, G. Vannier, A. Plissonnier et al., Fault diagnosis and classification of large-scale photovoltaic plants through aerial orthophoto thermal mapping, in Proc. 31st Eur. Photovolt. Sol. Energy Conf. (EU PVSEC) (Hamburg, Germany, 2015) [Google Scholar]
- SERENDI-PV (Smooth, reliable and dispatchable integration of PV in EU grids) (accessed April 19, 2025). https://serendipv.eu/ [Google Scholar]
- Logiciel (Software) “ASPIRE” ©CEA, licensing/registration No: IDDN.FR.001.140011.000.S.P.2020.000.30000 [Google Scholar]
- Figure available under Creative Commons Attribution 4.0 International licence [Google Scholar]
- A. Ammar, A. Koubaa, M. Ahmed et al., Vehicle detection from aerial images using deep learning: A comparative study, Electronics 10, 820 (2021) [CrossRef] [Google Scholar]
- T.-Y. Lin, P. Dollár, R. Girshick et al., Feature pyramid networks for object detection, in Proc. 2017 IEEE Conf. Comput. Vis. Pattern Recognit. (CVPR) (Honolulu, HI, USA, 2017), pp. 936–944 [Google Scholar]
- E. Shelhamer, J. Long, T. Darrell, Fully convolutional networks for semantic segmentation, IEEE Trans. Pattern Anal. Mach. Intell. 39, 640 (2017). https://doi.org/10.1109/TPAMI.2016.2572683 [CrossRef] [Google Scholar]
- L. Bommes, T. Pickel, C. Buerhop-Lutz et al., Computer vision tool for detection, mapping, and fault classification of photovoltaics modules in aerial IR videos, Prog. Photovolt. Res. Appl. 29, 1236 (2021) [CrossRef] [Google Scholar]
- J.A. Tsanakas, D.-L. Ha, C. Buerhop, Faults and infrared thermographic diagnosis in operating c-Si photovoltaic modules: A review of research and future challenges, Renew. Sustain. Energy Rev. 62, 695 (2016) [CrossRef] [Google Scholar]
- M. Mattei, G. Notton, C. Cristofari et al., Calculation of the polycrystalline PV module temperature using a simple method of energy balance, Renew. Energy 31, 553 (2006) [CrossRef] [Google Scholar]
- M. Köntges, S. Kurtz et al., Report IEA-PVPS T13-01: 2014 [Google Scholar]
- S. Vitale, J. Leloux, H. Colin et al., Shaping European collaboration on photovoltaics: A collaborative platform for simulation and monitoring (COPLASIMON), in Proc. EU PVSEC 2024 (Vienna, Austria, 2024) [Google Scholar]
- Collaborative Platform for Simulation and Monitoring (COPLASIMON) (accessed April 19, 2025). https://coplasimon.eu/index.php/the-cea-aspire-software/ [Google Scholar]
Cite this article as: John Ioannis A. Tsanakas, Philippe Marechal, Decoding pixels: A modular software prototype for cognitive image-based diagnostics of PV plants, EPJ Photovoltaics 16, 24 (2025), https://doi.org/10.1051/epjpv/2025013
All Figures
|
Fig. 1 Example architecture of the real-time object detection pipeline YOLO (on the left) and Mask R-CNN (on the right) algorithms [13–16]. |
| In the text | |
|
Fig. 2 Left: Example aIRT images of diverse features, employed in the database for auto-detection training. Right: Example outputs from initial auto-detection tests on aIRT images. |
| In the text | |
|
Fig. 3 Example raw aIRT (A) and aerial RGB (B) images imported and fused (C) in ASPIRE; (D) Detection of PV modules, from the fused aIRT–RGB image, using auto-segmentation; (E) Auto-detection of anomalies in a fused aIRT/RGB image (example case of open-circuited modules or strings). |
| In the text | |
|
Fig. 4 Initial (raw) hollow matrix of PV modules from an aIRT image, in ASPIRE (A). Hollow matrix with corrected PV modules in fault-free mode (B). Final hollow matrix for power loss calculation/analysis in ASPIRE (C). |
| In the text | |
|
Fig. 5 A: ASPIRE's insights and analysis dashboard for an example aIRT inspection case in a test PV site. B: Overall confusion matrix for the diagnostic study of the same test PV site. |
| In the text | |
|
Fig. 6 PV module-level dashboard; example of a defect checker and diagnostic analysis for the case of a PID. |
| In the text | |
|
Fig. 7 Left: ASPIRE's “defect checker” feature at PV module level, for the case of a bypass diode failure (Diode 1, left). Right: Output generated in the PV module-level dashboard, for the full analysis of the identified bypass diode failure. |
| In the text | |
|
Fig. 8 Group selection of PV modules for further diagnostic analysis (right), following initial auto-detection (left) and manual correction (middle) steps, (left), (middle), (right) (‘G1–R1–C1’) of the studied 62 MW PV plant demonstration. |
| In the text | |
|
Fig. 9 Detailed diagnostic analysis of G1-R1-C1, revealing a PV module with multiple hot spots. |
| In the text | |
|
Fig. 10 Left: Segmentation and detection of a PV module (‘G1–R1–CR1–C3’) suspected with bypass diode failure. Right: Thermal map analysis and ‘defect checker’ (detection mask) feature at PV module level, for the case of a bypass diode failure (Diode 3, right). |
| In the text | |
|
Fig. 11 Example of unsuccessful diagnosis, where two open-circuited PV modules (abnormal thermal patterns in G1-R1-C1) were overlooked and not flagged by ASPIRE as failures, whereas others (two modules at top right) are erroneously flagged (false positives). |
| In the text | |
Current usage metrics show cumulative count of Article Views (full-text article views including HTML views, PDF and ePub downloads, according to the available data) and Abstracts Views on Vision4Press platform.
Data correspond to usage on the plateform after 2015. The current usage metrics is available 48-96 hours after online publication and is updated daily on week days.
Initial download of the metrics may take a while.