Fig. 9
Download original image
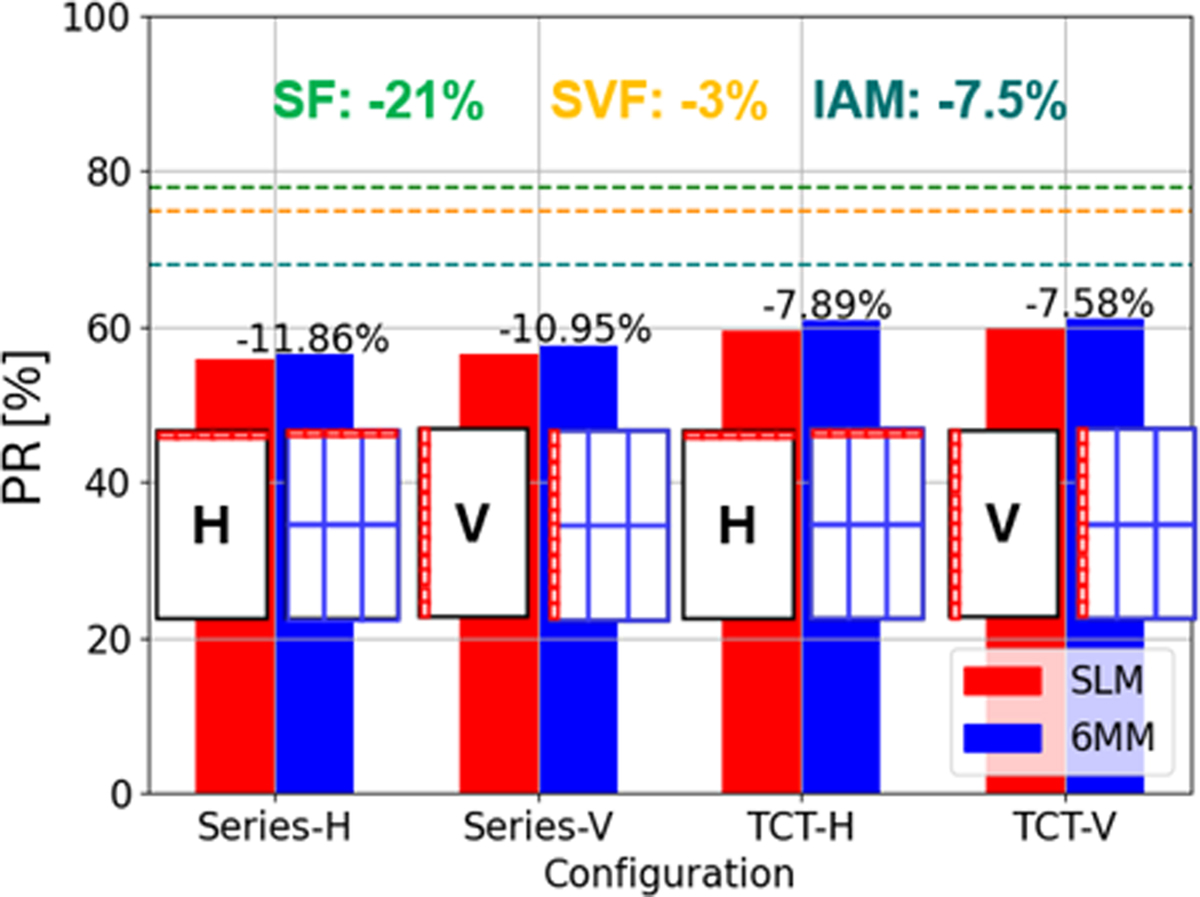
Performance Ratio (PR) on the route with every configuration, with red bars representing the energy of SLM layout and blue bars representing the energy of 6 MM layout. The 100% corresponds to an unshaded module of similar characteristics at 25°C under a uniform GHI during the same period. The rectangles on each bar illustrate the cell orientation and module layout, with the small red grid showing the first row or column of cells, depending on the orientation. The numbers above the bars indicate the average mismatch associated losses. The dashed lines indicate the losses due to SF (green), SVF (yellow) and IAM (teal), with the corresponding coloured numbers expressing the values.
Current usage metrics show cumulative count of Article Views (full-text article views including HTML views, PDF and ePub downloads, according to the available data) and Abstracts Views on Vision4Press platform.
Data correspond to usage on the plateform after 2015. The current usage metrics is available 48-96 hours after online publication and is updated daily on week days.
Initial download of the metrics may take a while.