Fig. 7
Download original image
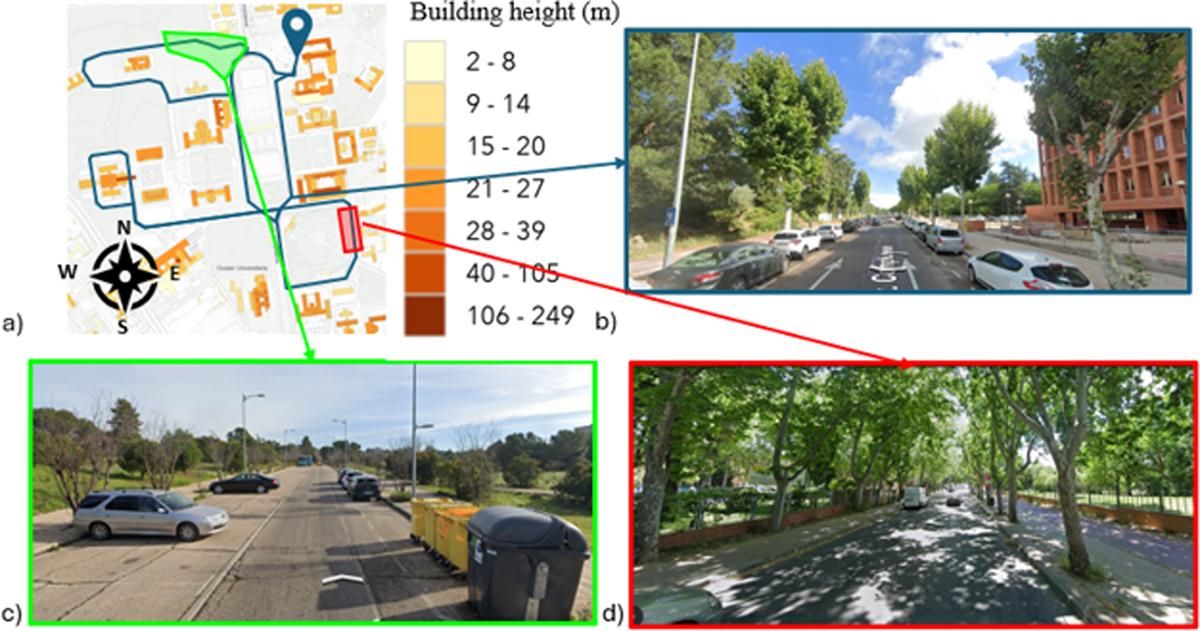
a) Map indicating the driving route of the experiment. The blue marker on the top right corner indicates the start and end of the route. The colour bar indicates the height of the building. The majority of the route corresponds to an “Open Midrise” category. The green patch corresponds to a “Scattered Trees” category and the red one to “Dense Trees”. b) Google Earth image of a section of the route categorized as “Open Midrise”, corresponding to May. c) Google Earth image of a section of the route categorized as “Scattered Trees”, corresponding to June. d) Google Earth image of a section of the route categorized as “Dense Trees”, corresponding to May. e) Speed of the vehicle over the experiment's timelapse.
Current usage metrics show cumulative count of Article Views (full-text article views including HTML views, PDF and ePub downloads, according to the available data) and Abstracts Views on Vision4Press platform.
Data correspond to usage on the plateform after 2015. The current usage metrics is available 48-96 hours after online publication and is updated daily on week days.
Initial download of the metrics may take a while.