Fig. 5
Download original image
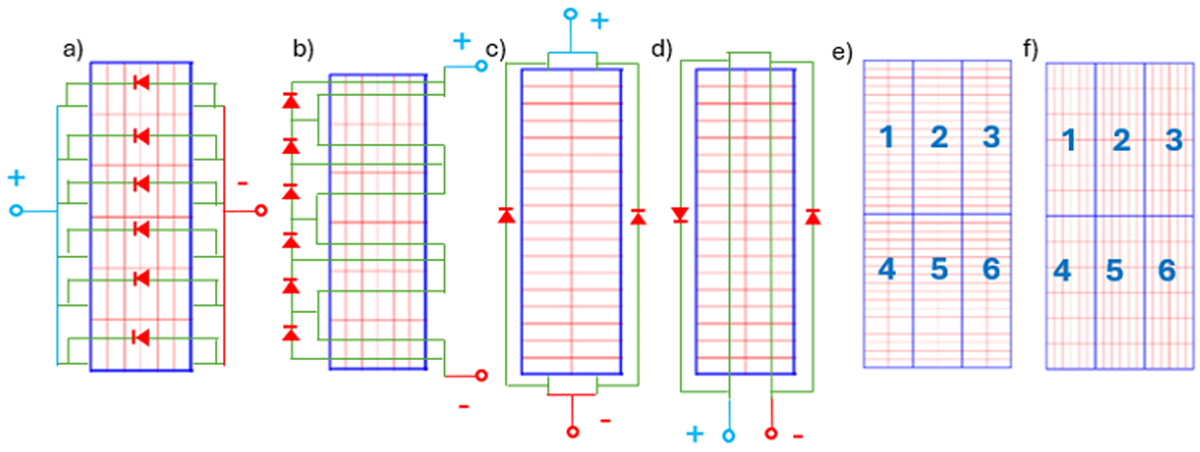
Mini-module architecture summary. The negative and positive terminals are represented by the red and blue circles, respectively. The cells are represented by the red grid elements. a) MM-TCT-V. b) MM −Series-V. c) MM −TCT-H d) MM −Series-V. e) Distribution of mini-modules on the active PV surface with horizontal cells, including numeration. f) Distribution of mini-modules on the active PV surface with vertical cells, including numeration.
Current usage metrics show cumulative count of Article Views (full-text article views including HTML views, PDF and ePub downloads, according to the available data) and Abstracts Views on Vision4Press platform.
Data correspond to usage on the plateform after 2015. The current usage metrics is available 48-96 hours after online publication and is updated daily on week days.
Initial download of the metrics may take a while.