Fig. 3
Download original image
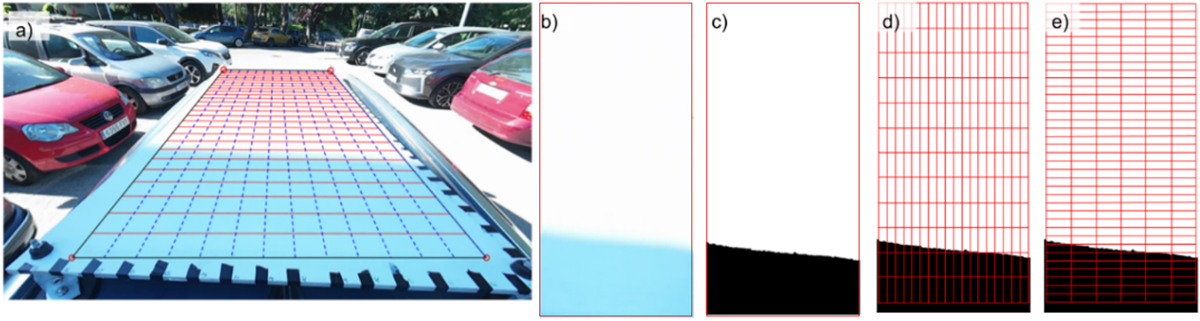
a) Video frame with projected rectangular grid. b) Extracted rectangular area from the video, after angular transformations. c) Binarized area in black and white. d) Black and white area with grid representing vertical cell orientation. e) Black and white area with grid representing horizontal cell orientation.
Current usage metrics show cumulative count of Article Views (full-text article views including HTML views, PDF and ePub downloads, according to the available data) and Abstracts Views on Vision4Press platform.
Data correspond to usage on the plateform after 2015. The current usage metrics is available 48-96 hours after online publication and is updated daily on week days.
Initial download of the metrics may take a while.