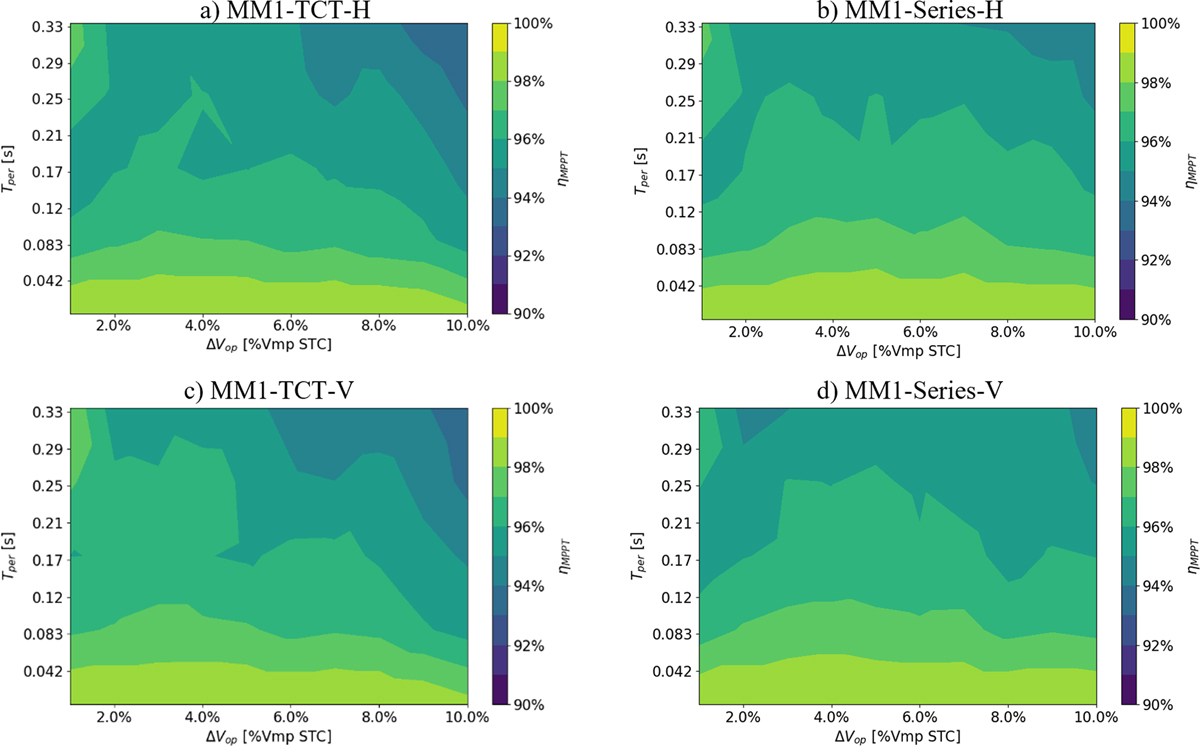
Fig. 12
Download original image
Efficiency of mini-module 1 (MM1) over the entire dataset with different configurations, indicated above each graph. The Y axis indicates the perturbation period in seconds, and the X axis indicates the perturbation size, expressed as a percentage of VMP of the module in STC (1000 W/m2, 25°C).
Current usage metrics show cumulative count of Article Views (full-text article views including HTML views, PDF and ePub downloads, according to the available data) and Abstracts Views on Vision4Press platform.
Data correspond to usage on the plateform after 2015. The current usage metrics is available 48-96 hours after online publication and is updated daily on week days.
Initial download of the metrics may take a while.