Fig. 11
Download original image
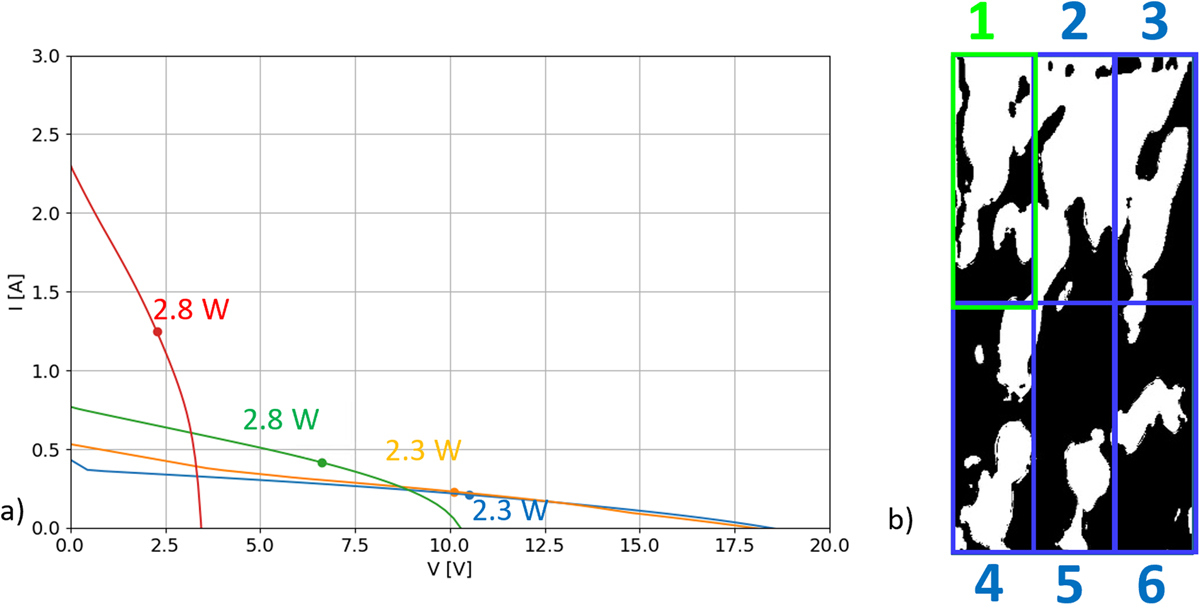
a) IV curves of the MM1 with different cell interconnections and configurations under the partial shading situation shown on b), with the dots and numbers representing the maximum power point of the IV curve. The colours in both numbers and lines represent different configurations: Red, MM1-TCT-V; green, MM1-TCT-H; orange,MM1-Series-V and blue, MM1-Series-H. b) Shading pattern over the module with the blue rectangles showing the location and numeration of the 6 MM. MM1 is emphasized in bright green.
Current usage metrics show cumulative count of Article Views (full-text article views including HTML views, PDF and ePub downloads, according to the available data) and Abstracts Views on Vision4Press platform.
Data correspond to usage on the plateform after 2015. The current usage metrics is available 48-96 hours after online publication and is updated daily on week days.
Initial download of the metrics may take a while.