Fig. 10
Download original image
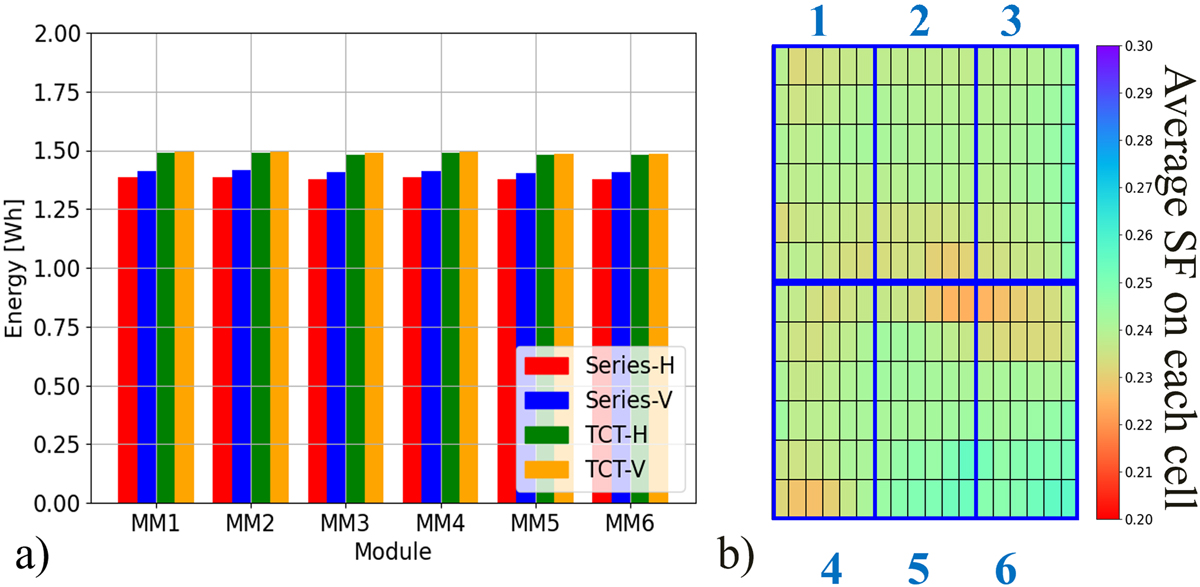
a) Distribution of available energy across the 6 mini-modules in every scenario. b) Average shading factor on each cell during the route. The average value of SF among cells is 0.24, and the standard deviation is 0.006. The blue rectangles delimitate each submodule. The numbers above and below the graph indicate the MM number.
Current usage metrics show cumulative count of Article Views (full-text article views including HTML views, PDF and ePub downloads, according to the available data) and Abstracts Views on Vision4Press platform.
Data correspond to usage on the plateform after 2015. The current usage metrics is available 48-96 hours after online publication and is updated daily on week days.
Initial download of the metrics may take a while.