Fig. 16
Download original image
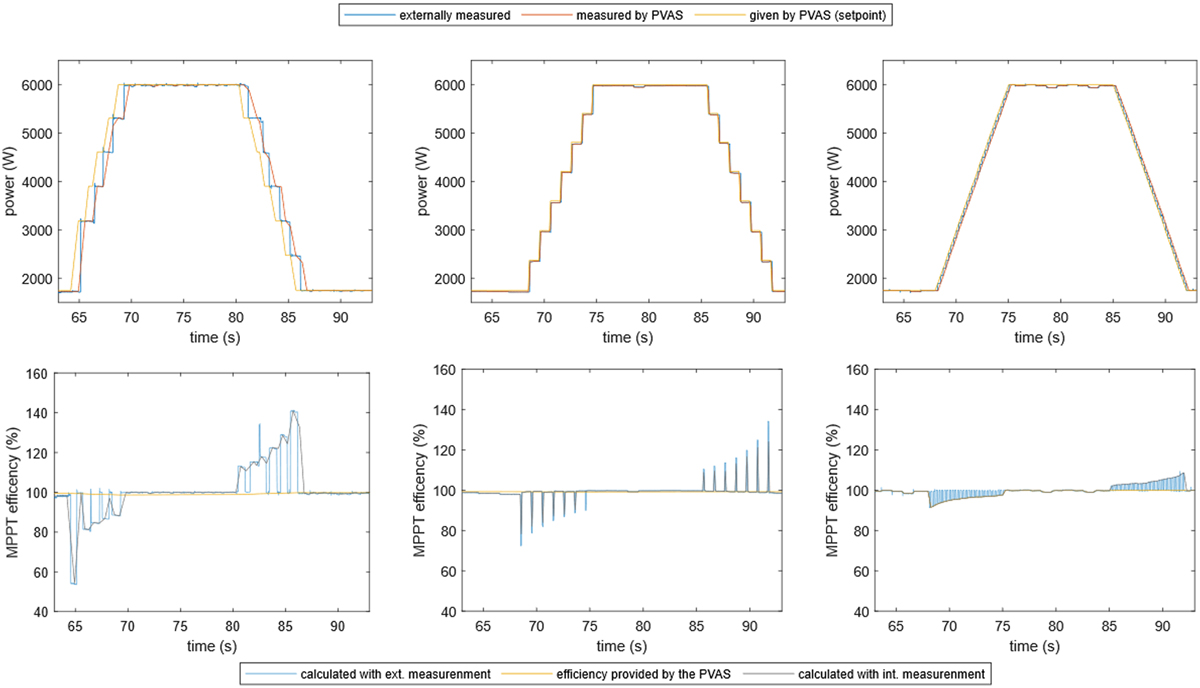
Time evolution of the MPPT efficiency measurement of PVAS1 (left), PVAS2 (middle), and PVAS3 (right). The upper plots show the prescribed and the measured power, while the lower plots illustrate the resulting MPPT efficiency.
Current usage metrics show cumulative count of Article Views (full-text article views including HTML views, PDF and ePub downloads, according to the available data) and Abstracts Views on Vision4Press platform.
Data correspond to usage on the plateform after 2015. The current usage metrics is available 48-96 hours after online publication and is updated daily on week days.
Initial download of the metrics may take a while.