Fig. 4
Download original image
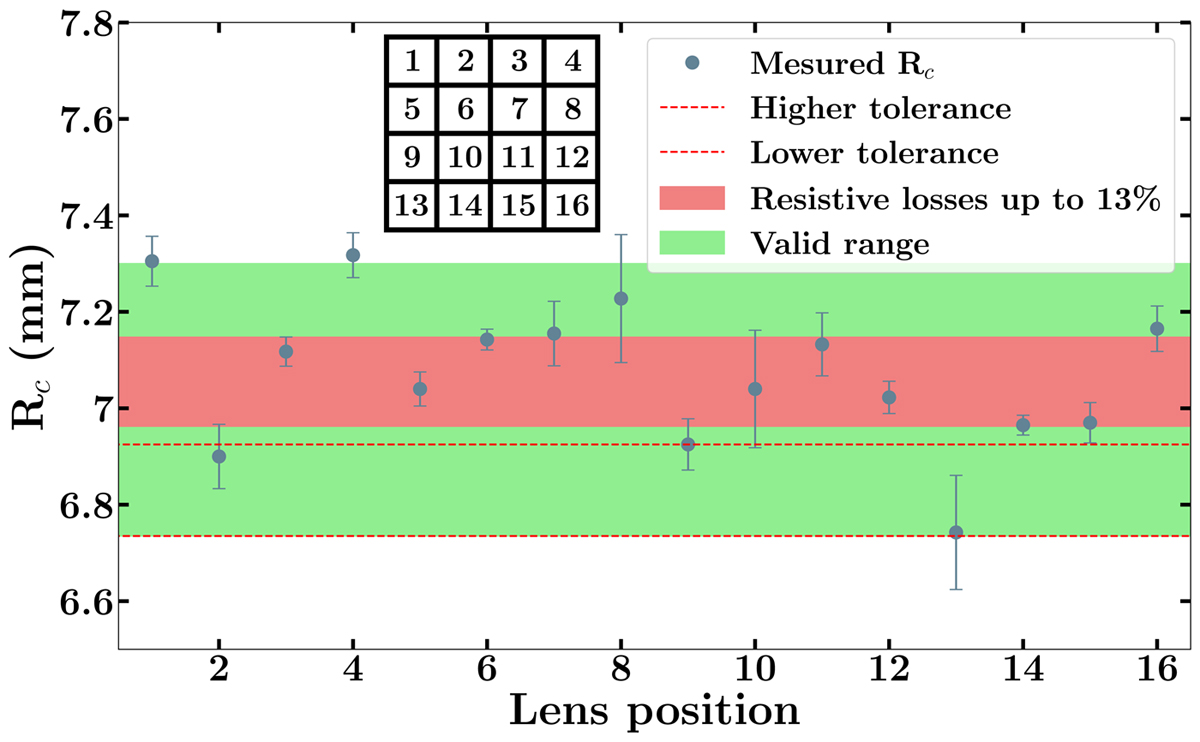
Curvature radius as a function of lenses position. Each point corresponds to the average of the measurements on 4 different optical matrices, and the error bars represent the standard deviation between these 4 measurements. The uncertainty of measurement is ± 30 μm. Each lens is identified by a number (lens position). A mark (where the PMMA was injected during molding) ensures the same lens identification on all four matrices. The red dashed lines represent the tolerance analysis calculated in Section 2.3. The green area corresponds to the ranges of R that meet the fixed constraints (even if the tolerance is not met), while the red area indicates the data ranges where resistive losses reach 13% (>10% set), as explained at the end of Section 2.3.
Current usage metrics show cumulative count of Article Views (full-text article views including HTML views, PDF and ePub downloads, according to the available data) and Abstracts Views on Vision4Press platform.
Data correspond to usage on the plateform after 2015. The current usage metrics is available 48-96 hours after online publication and is updated daily on week days.
Initial download of the metrics may take a while.