Fig. 2
Download original image
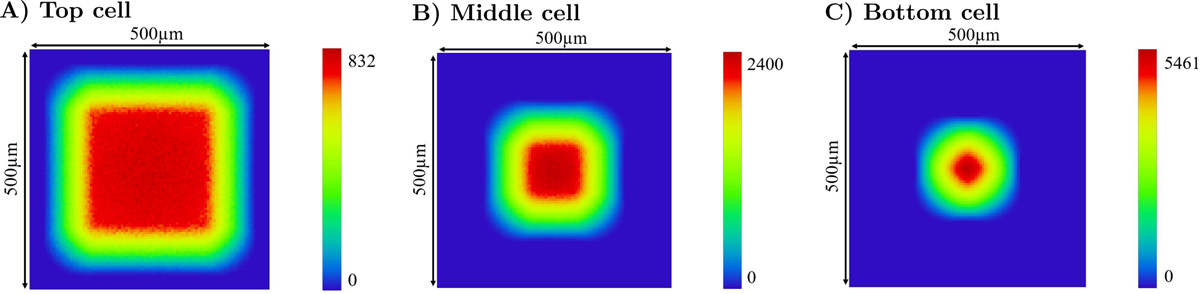
ZEMAX optical simulation of the illuminance of a 0.25 mm2 solar cell as a function of wavelength A) 500 nm (top cell), B) 800 nm (middle cell) and C) 1300nm (bottom cell). The scale on the right of the images corresponds to the effective concentration. The average concentration is 350×, so from the maximum effective concentration of each sub-cell, we can calculate the PAR for each sub-cell: top cell: 2.38, middle cell: 6.85, bottom cell: 15.6.
Current usage metrics show cumulative count of Article Views (full-text article views including HTML views, PDF and ePub downloads, according to the available data) and Abstracts Views on Vision4Press platform.
Data correspond to usage on the plateform after 2015. The current usage metrics is available 48-96 hours after online publication and is updated daily on week days.
Initial download of the metrics may take a while.