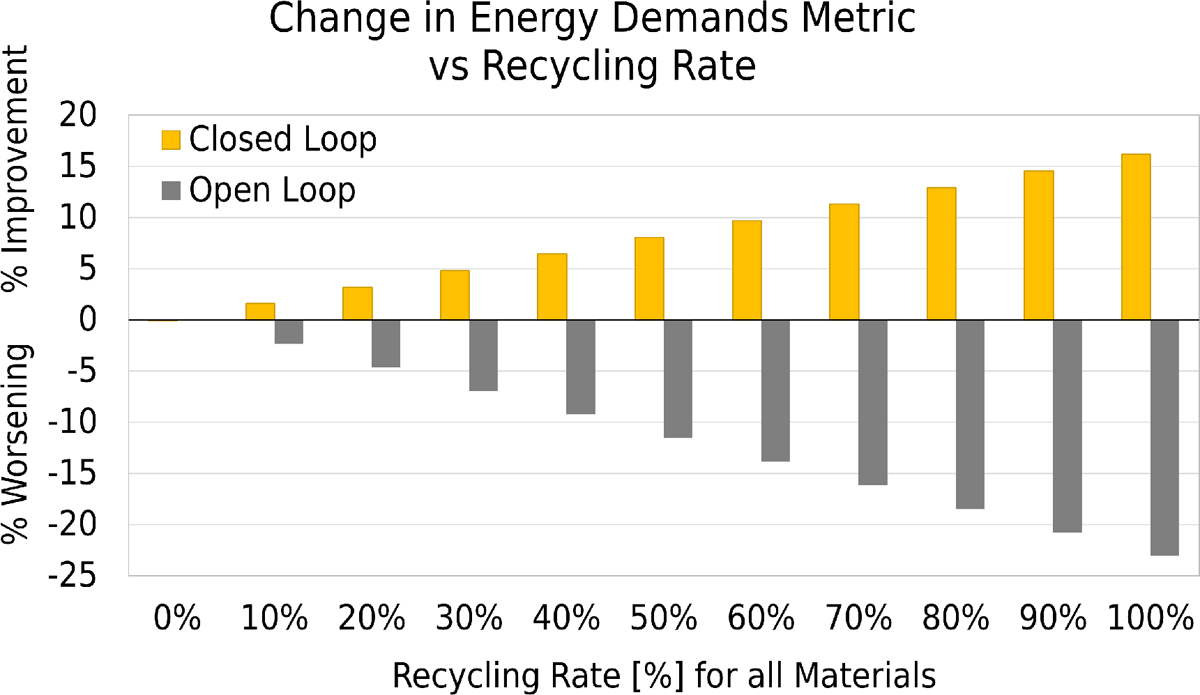
Fig. B.2

Download original image
A bar plot showing the change (improvement or worsening) in cumulative Energy Demands (as compared to the PV ICE baseline) as a function of material recycling rate (glass, silicon, silver, aluminium frames only). Gold bars are closed-loop recycling, which offset virgin material demand, grey bars are open-loop recycling. Closed-loop recycling gleans energy savings by offsetting virgin material demand.
Current usage metrics show cumulative count of Article Views (full-text article views including HTML views, PDF and ePub downloads, according to the available data) and Abstracts Views on Vision4Press platform.
Data correspond to usage on the plateform after 2015. The current usage metrics is available 48-96 hours after online publication and is updated daily on week days.
Initial download of the metrics may take a while.


