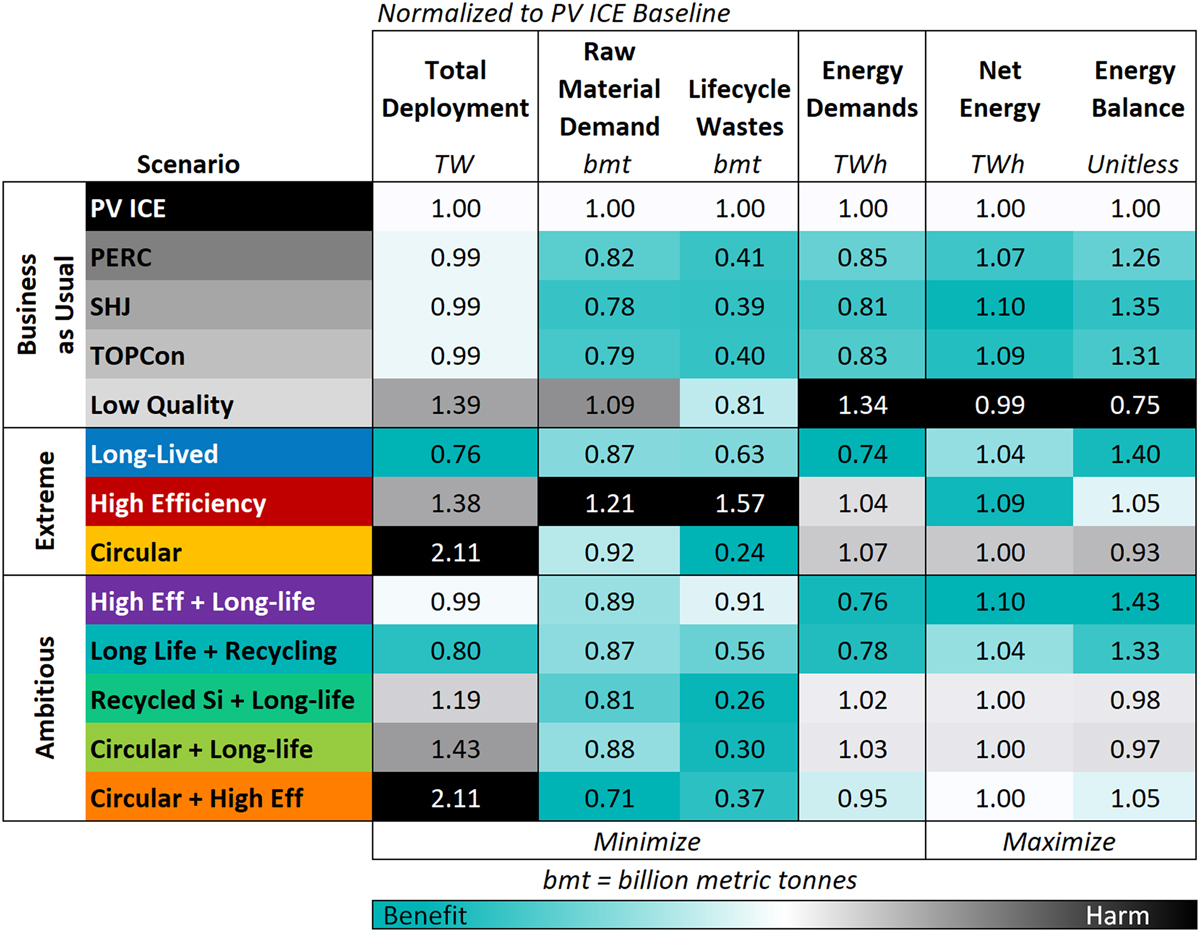
Fig. C.4

Download original image
: A comparison of the PV module design scenarios (rows) across the six mass and energy metrics (columns) normalized to the PV ICE Baseline scenario results. The first 4 metrics should be minimized while the last two metrics should be maximized. The numbers in cells are the result in each metric for each module scenario normalized to the PV ICE Baseline, rounded to 2 decimal places. The color scale (teal to black) is centered on 1.0 (white), more teal is improvement relative to the baseline, more black is worsening. Normalizing the matrix emphasizes the poor performance of short life and low efficiency scenarios.
Current usage metrics show cumulative count of Article Views (full-text article views including HTML views, PDF and ePub downloads, according to the available data) and Abstracts Views on Vision4Press platform.
Data correspond to usage on the plateform after 2015. The current usage metrics is available 48-96 hours after online publication and is updated daily on week days.
Initial download of the metrics may take a while.


