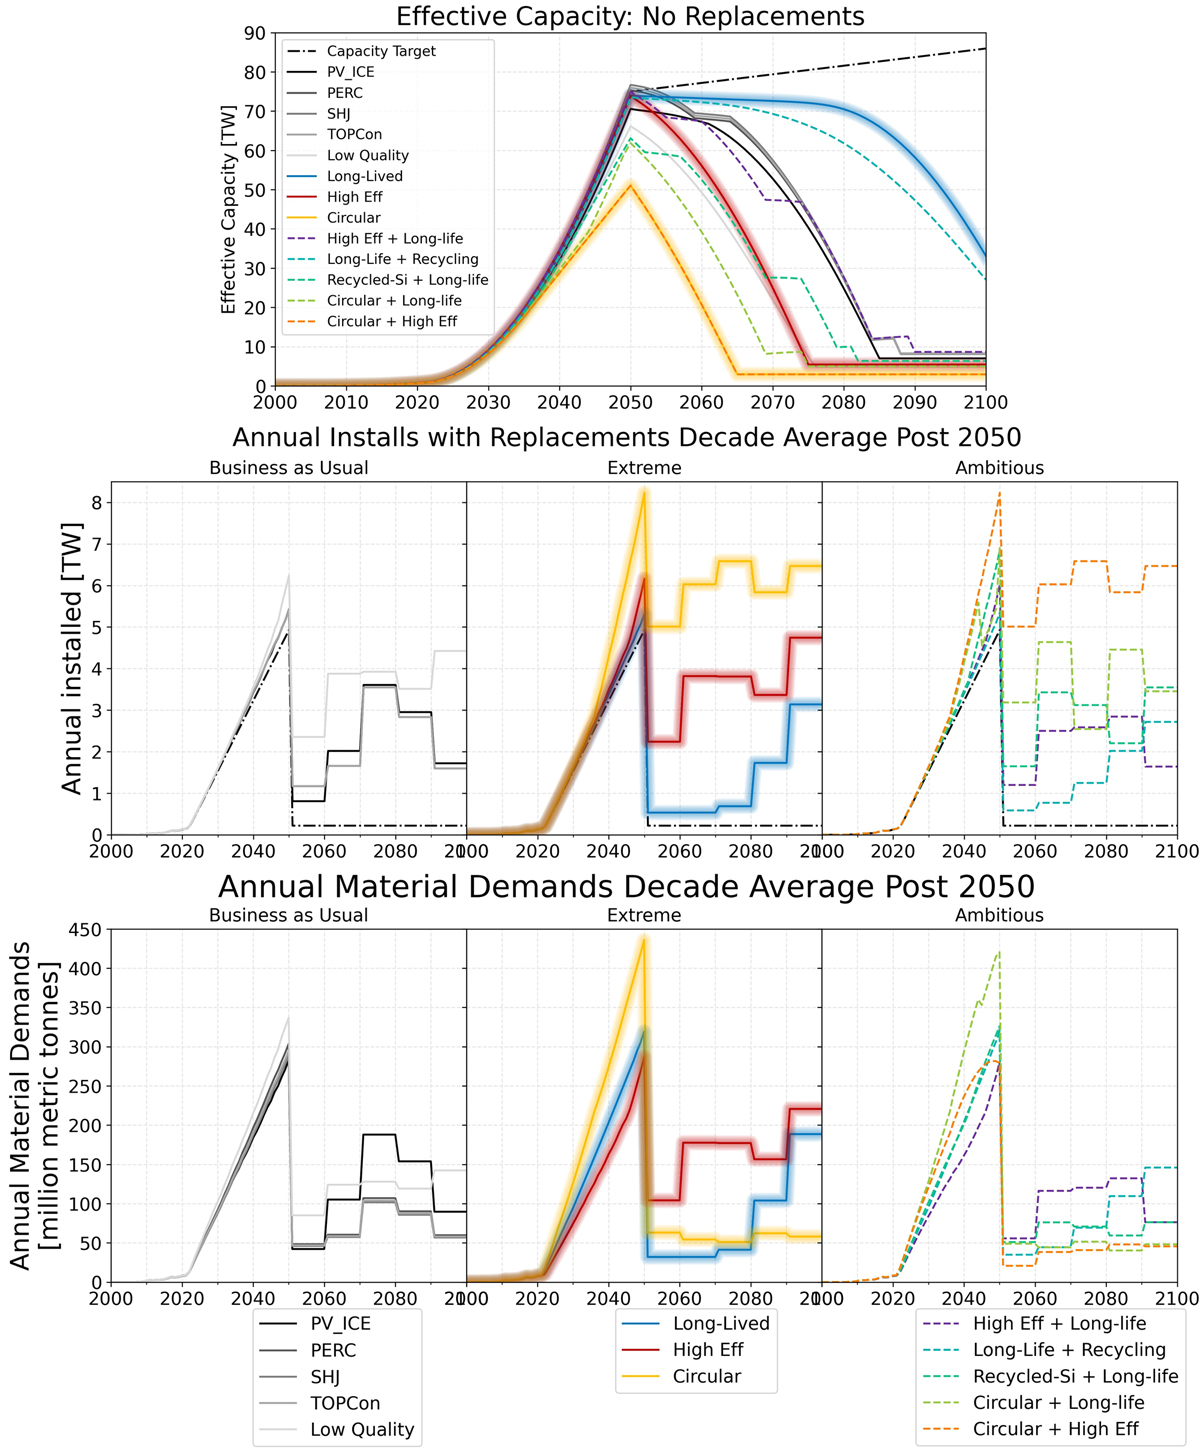
Fig. C.1

Download original image
The (a) Effective Capacity (installations minus module degradation, failures, and end of life, and assumes no replacements) from 2000 to 2100 of each scenario compared to the capacity targets (black dashed line). The (b) annual installations including replacements to meet capacity targets and associated (c) annual virgin material demands accounting for material circularity for all scenarios 2000–2100. In (b), the theoretical minimum deployment (i.e. immortal modules) is shown in the black dashed line. Post-2050 installations and material demands are the average annual rate during each decade.
Current usage metrics show cumulative count of Article Views (full-text article views including HTML views, PDF and ePub downloads, according to the available data) and Abstracts Views on Vision4Press platform.
Data correspond to usage on the plateform after 2015. The current usage metrics is available 48-96 hours after online publication and is updated daily on week days.
Initial download of the metrics may take a while.


