Fig. 18
Download original image
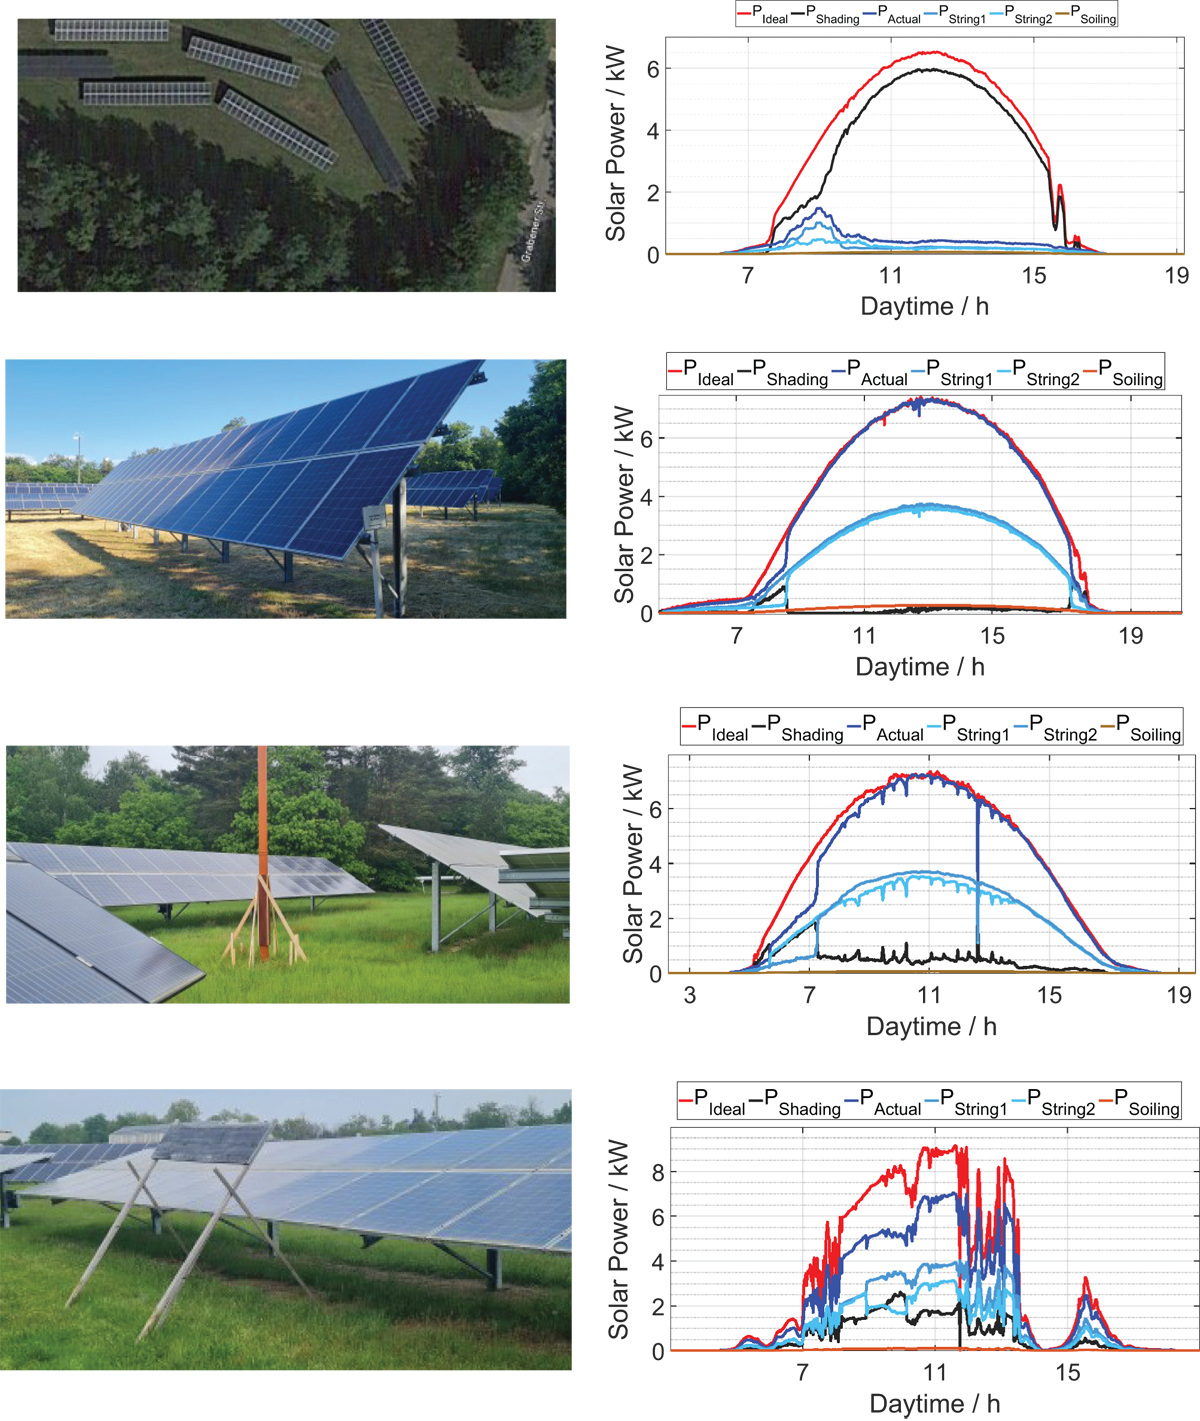
Various shading structures on the arrays and their impact on the generated power. The calculated portion of the power falling on the shading is shown in black. The theoretical maximum power is reduced by this amount.
Current usage metrics show cumulative count of Article Views (full-text article views including HTML views, PDF and ePub downloads, according to the available data) and Abstracts Views on Vision4Press platform.
Data correspond to usage on the plateform after 2015. The current usage metrics is available 48-96 hours after online publication and is updated daily on week days.
Initial download of the metrics may take a while.