Fig. 6
Download original image
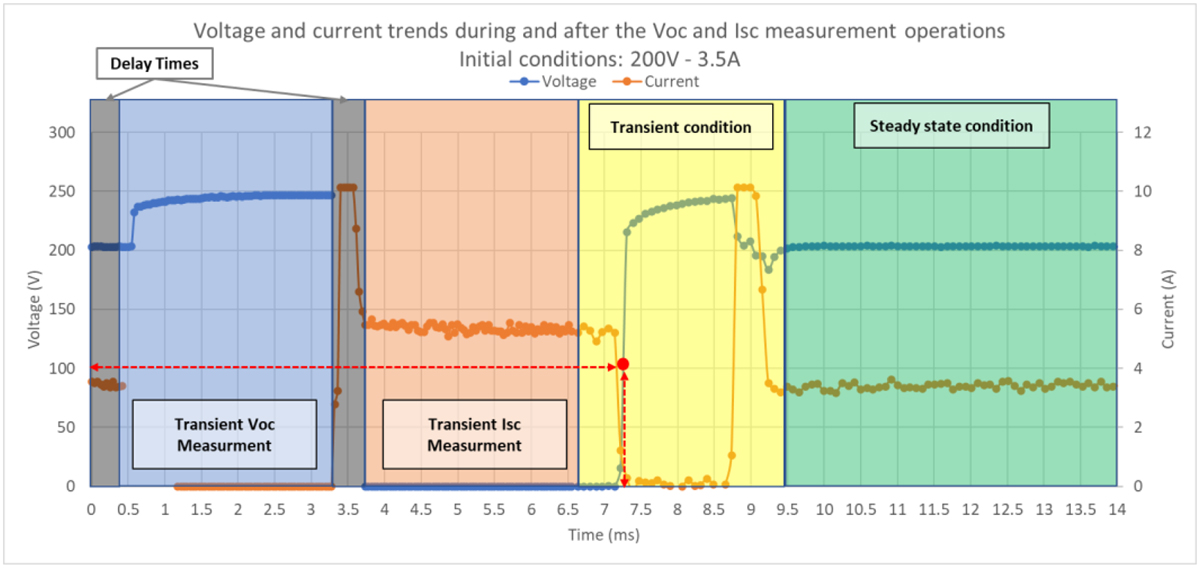
The graph shows the voltage and current trend both during the Voc and Isc measurement phase (blue and red areas) and immediately after reconnection to the electronic load (yellow and green areas). It can be observed that, after about 7.25 ms from the activation of the measurements, in correspondence with the transient return to operating conditions (yellow area), the voltage rises to a value close to 100 V (which could be representative of the minimum voltage of a small commercial inverter). After about 9.5 ms from the start of EIDPS operation, the steady state conditions are restored.
Current usage metrics show cumulative count of Article Views (full-text article views including HTML views, PDF and ePub downloads, according to the available data) and Abstracts Views on Vision4Press platform.
Data correspond to usage on the plateform after 2015. The current usage metrics is available 48-96 hours after online publication and is updated daily on week days.
Initial download of the metrics may take a while.