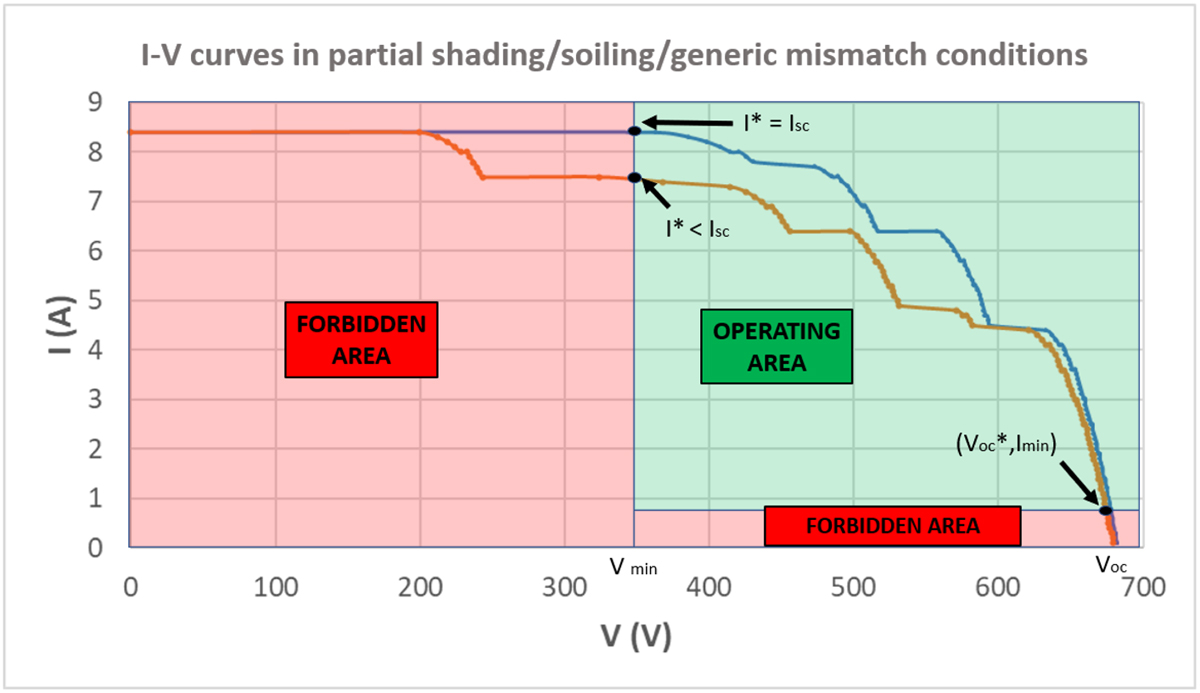
Fig. 1
Download original image
I-V curves of a PV string under two different partial shading conditions are shown. The red areas (forbidden areas) include the I-V curve points that cannot be reached by a hypothetical inverter due to its voltage and current constraints. The PV string working point can only be set by the inverter in the green area (operating area). In orange, an I-V curve traced when more than 50% of the modules are shaded (or dirty); in blue, an I-V curve traced when the shading (or soiling) involves less than 50% of the modules. It can be pointed out that in the case of the orange curve, the current value I*, measured in correspondence with the minimum voltage of the inverter, is lower than the correct Isc value. Instead, in the case of the blue curve, the value of I* coincides with Isc.
Current usage metrics show cumulative count of Article Views (full-text article views including HTML views, PDF and ePub downloads, according to the available data) and Abstracts Views on Vision4Press platform.
Data correspond to usage on the plateform after 2015. The current usage metrics is available 48-96 hours after online publication and is updated daily on week days.
Initial download of the metrics may take a while.