Fig. 7

Download original image
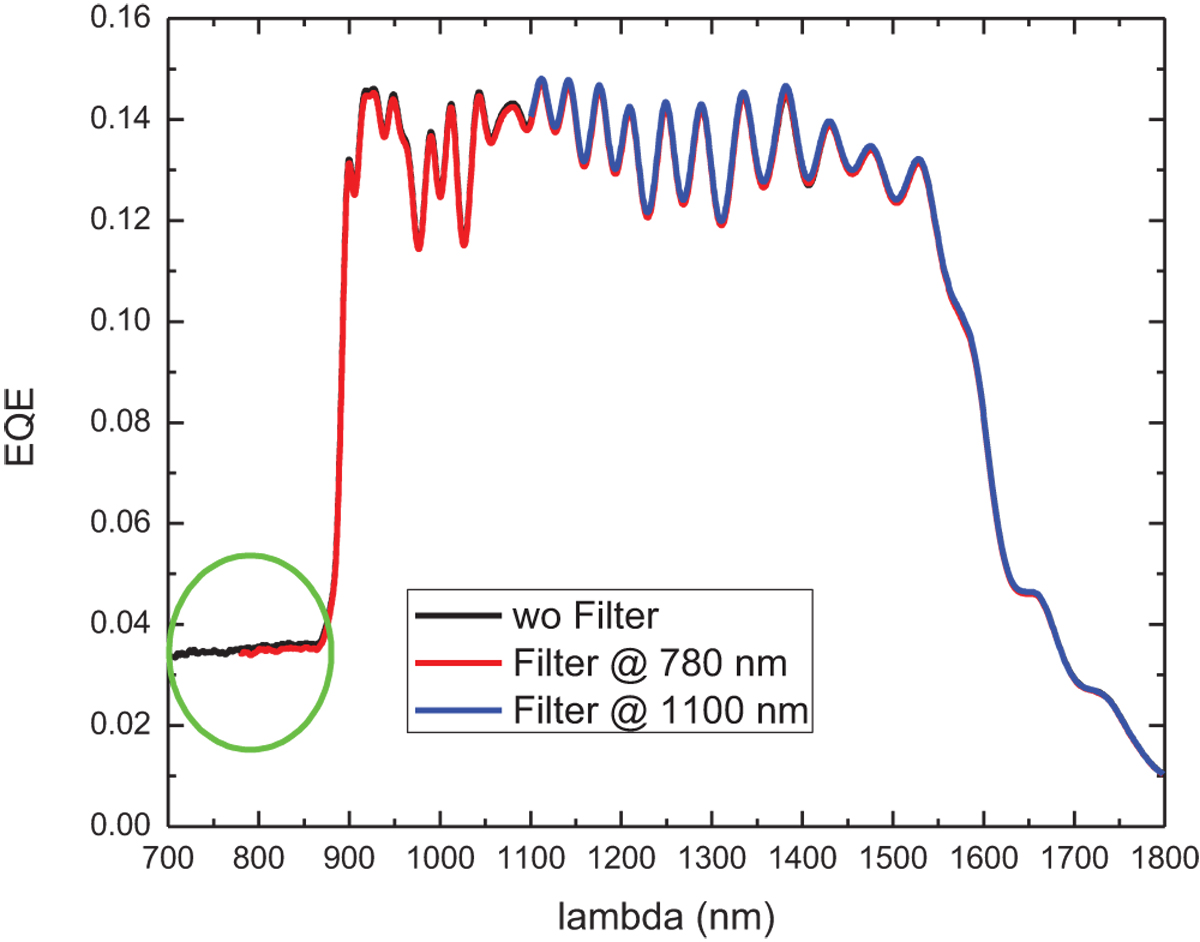
EQE response of an isotype cell where only the bottom junction is active. In the regions where they can be measured the responses are the same independently of the used filters. The green circle indicates a contribution of the Ge cell even in the region where the light is assumed to be absorbed by the cells above.
Current usage metrics show cumulative count of Article Views (full-text article views including HTML views, PDF and ePub downloads, according to the available data) and Abstracts Views on Vision4Press platform.
Data correspond to usage on the plateform after 2015. The current usage metrics is available 48-96 hours after online publication and is updated daily on week days.
Initial download of the metrics may take a while.


