Fig. 3
Download original image
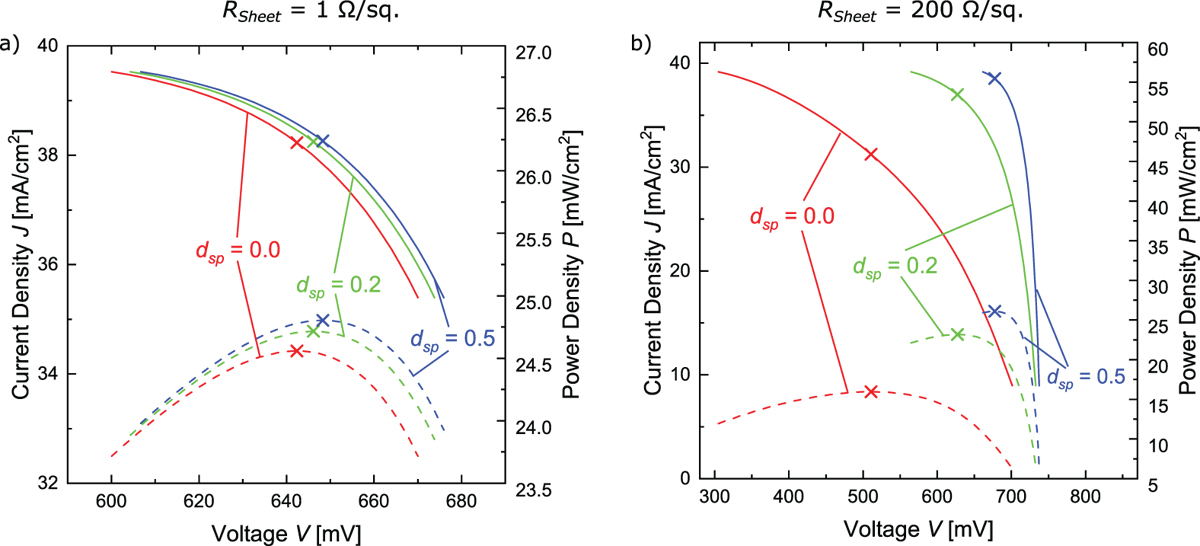
I-V (compact line) and P-V (dashed line) curves around the maximum power point of HJT solar cells with sheet resistances of (a) 1 Ω/sq and (b) 200 Ω/sq for different positions of the voltage sense contact dsp using a contacting unit consisting of 12 current wires. The respective MPPs are depicted as crosses.
Current usage metrics show cumulative count of Article Views (full-text article views including HTML views, PDF and ePub downloads, according to the available data) and Abstracts Views on Vision4Press platform.
Data correspond to usage on the plateform after 2015. The current usage metrics is available 48-96 hours after online publication and is updated daily on week days.
Initial download of the metrics may take a while.