Open Access
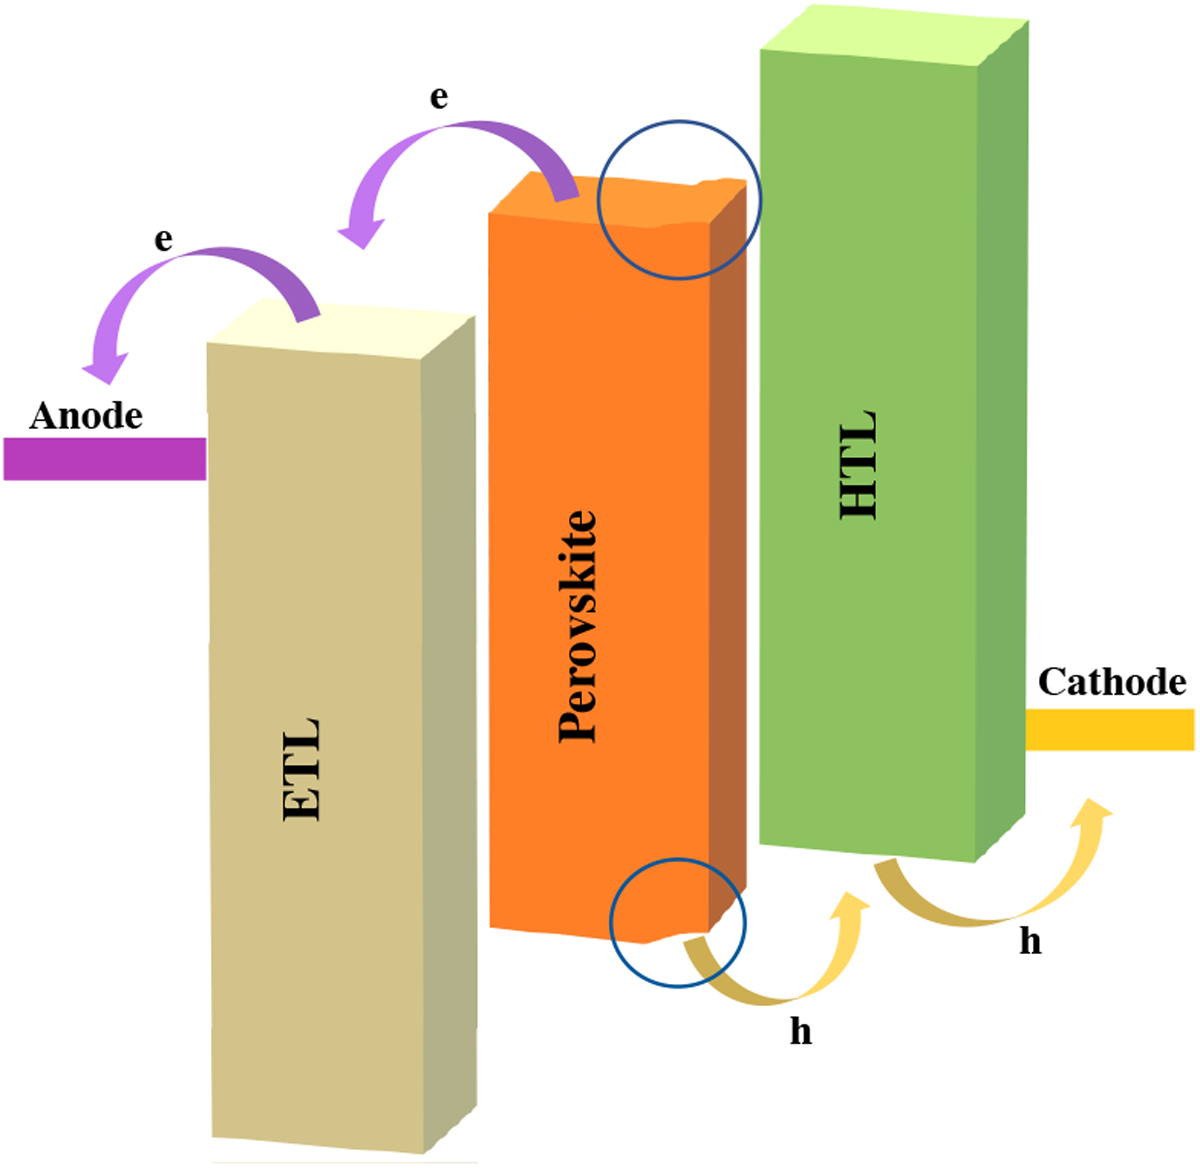
Fig. 15
Download original image
Perovskite surface energy levels shifting scheme. The regions shown in the blue circles show the shifted conduction and valence bands of the perovskite layer near the perovskite/HTL interface. Both the conduction and valence bands are shifted by the same amount.
Current usage metrics show cumulative count of Article Views (full-text article views including HTML views, PDF and ePub downloads, according to the available data) and Abstracts Views on Vision4Press platform.
Data correspond to usage on the plateform after 2015. The current usage metrics is available 48-96 hours after online publication and is updated daily on week days.
Initial download of the metrics may take a while.