Open Access
Fig. 4
Download original image
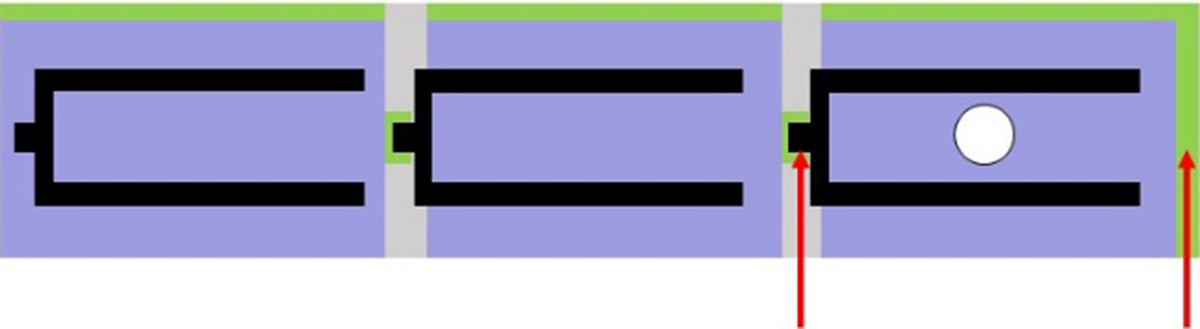
Schematic of a typical 3-cell module. It shows Mo (green), AZO (purple), metallic grids (black). The red arrows define the front and back contacts for both J(V) and EQE individual measurements. The white filled circle illustrates the illuminated area for EQE measurement.
Current usage metrics show cumulative count of Article Views (full-text article views including HTML views, PDF and ePub downloads, according to the available data) and Abstracts Views on Vision4Press platform.
Data correspond to usage on the plateform after 2015. The current usage metrics is available 48-96 hours after online publication and is updated daily on week days.
Initial download of the metrics may take a while.