Fig. 6
Download original image
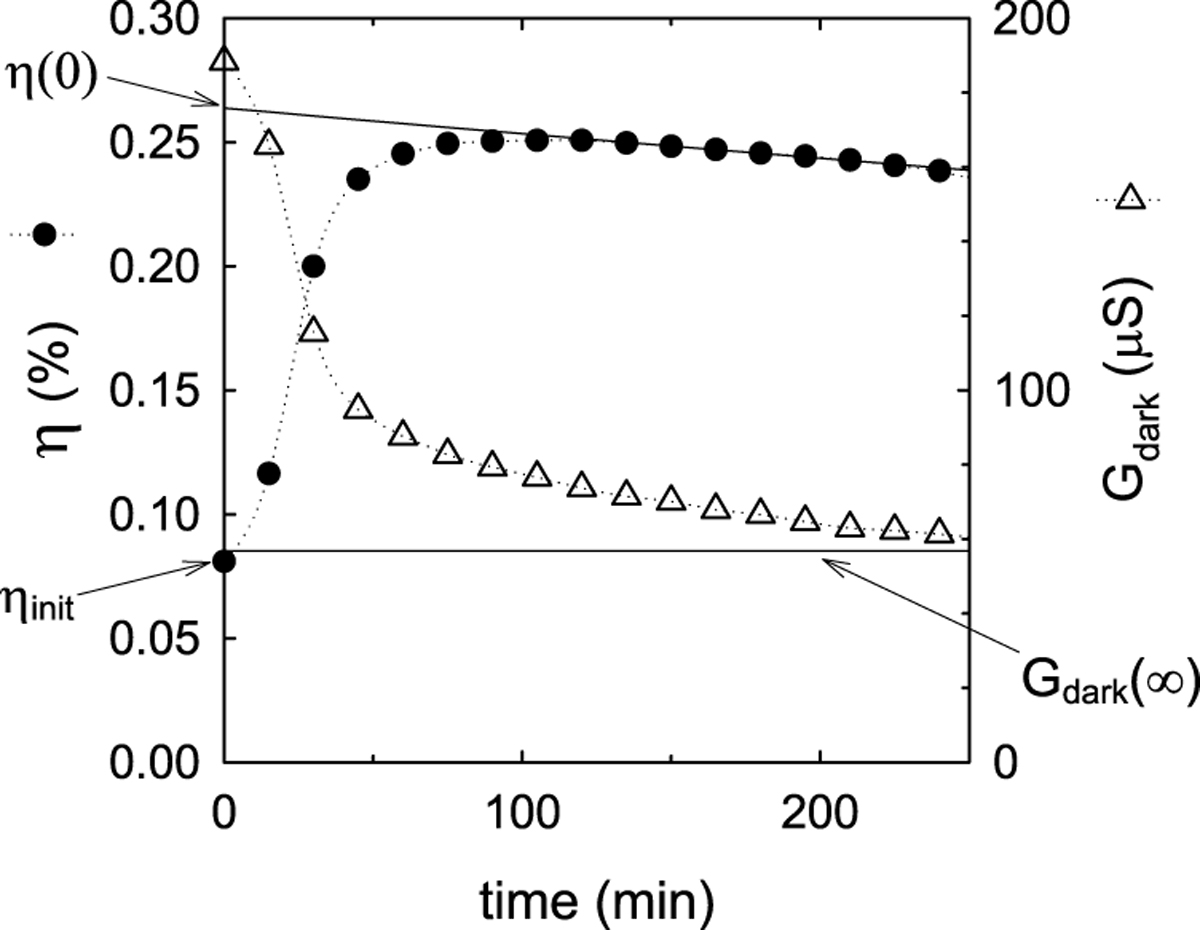
The power conversion efficiency (filled circles) and the zero-bias dark conductance (open triangles) of one sample as a function of time. We note the clear correlation between the decrease in conductance and the increase in efficiency. Denoted on the figure are the symbol that represents the initial efficiency (ηinit), the extrapolated point on the y-axis that represents the t = 0 efficiency (η(0)) and the line representing the asymptotic conductance value after long times (Gdark(∞)); these values are explained in the discussion.
Current usage metrics show cumulative count of Article Views (full-text article views including HTML views, PDF and ePub downloads, according to the available data) and Abstracts Views on Vision4Press platform.
Data correspond to usage on the plateform after 2015. The current usage metrics is available 48-96 hours after online publication and is updated daily on week days.
Initial download of the metrics may take a while.