Open Access
Fig. 5
Download original image
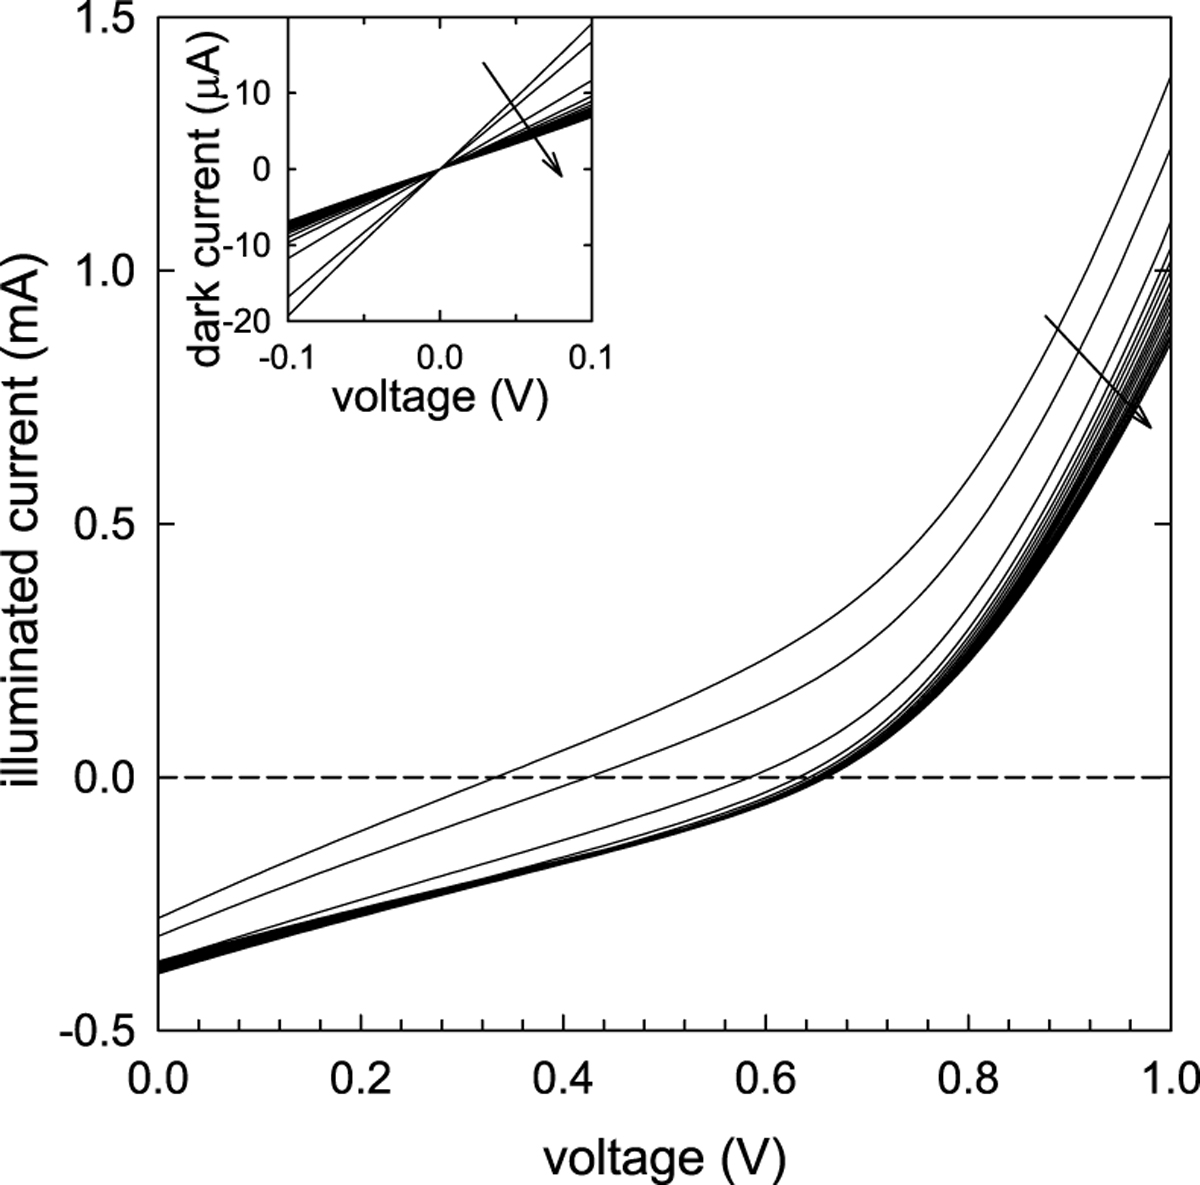
Current-voltage (I–V) curves showing an initial increase in both open-circuit voltage and short-circuit current (main frame). The inset shows the corresponding zero-bias I–V curves while the sample is in the dark. The progression of time is indicated by the arrows.
Current usage metrics show cumulative count of Article Views (full-text article views including HTML views, PDF and ePub downloads, according to the available data) and Abstracts Views on Vision4Press platform.
Data correspond to usage on the plateform after 2015. The current usage metrics is available 48-96 hours after online publication and is updated daily on week days.
Initial download of the metrics may take a while.