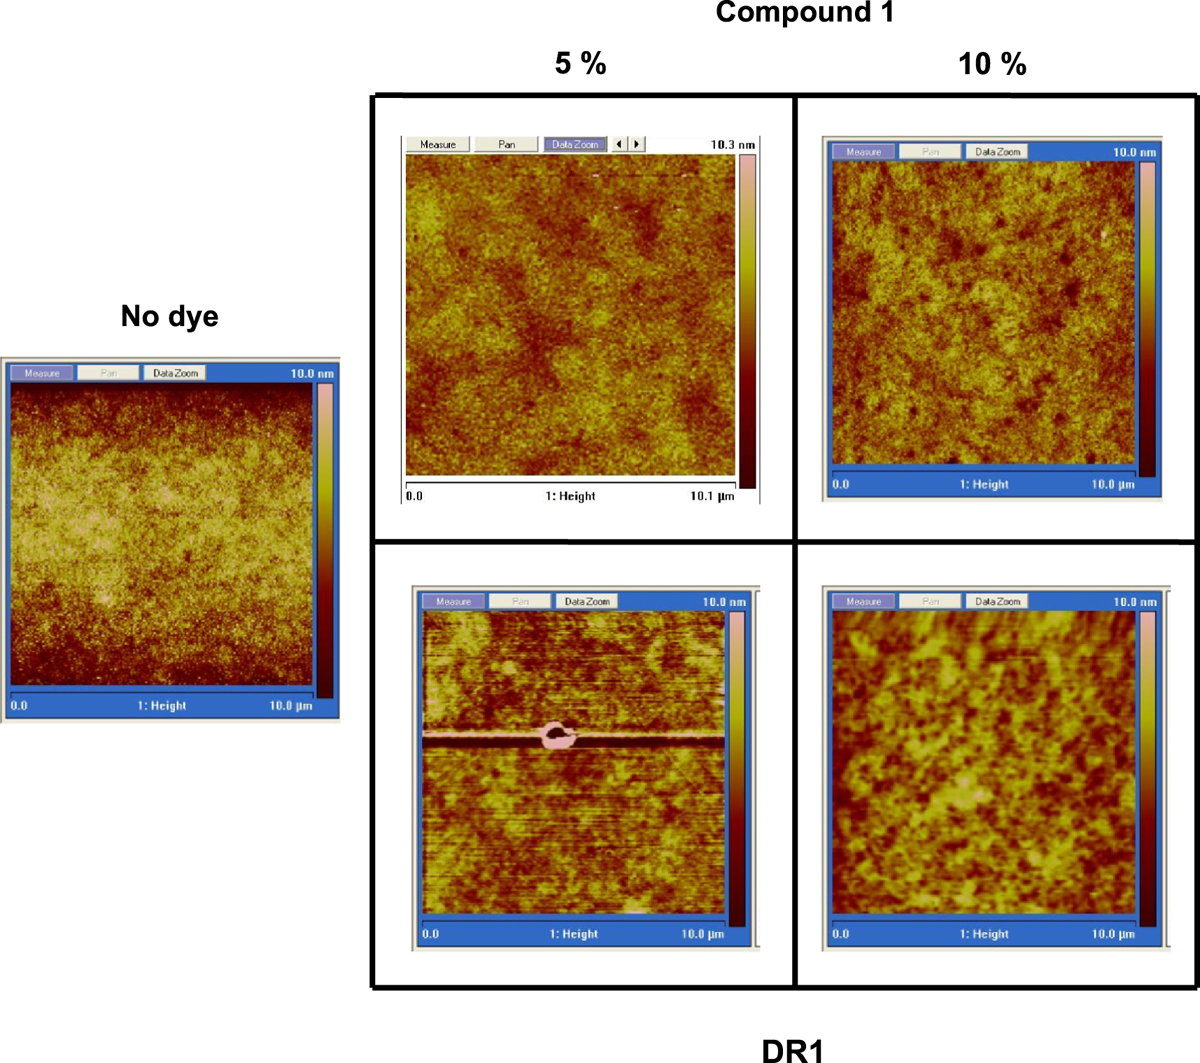
Fig. 4
Download original image
Atomic force microscope images the reveal the surface morphology of the active layers without Al contacts. The leftmost frame shows a PCBM:P3HT sample without dye. The two columns show the effects of green dye (1, top row) and red dye (DR1, bottom row) at 5% and 10% weight concentrations with respect to the PCBM content. The addition of both dyes clearly enhances aggregation in the samples.
Current usage metrics show cumulative count of Article Views (full-text article views including HTML views, PDF and ePub downloads, according to the available data) and Abstracts Views on Vision4Press platform.
Data correspond to usage on the plateform after 2015. The current usage metrics is available 48-96 hours after online publication and is updated daily on week days.
Initial download of the metrics may take a while.