Fig. 3
Download original image
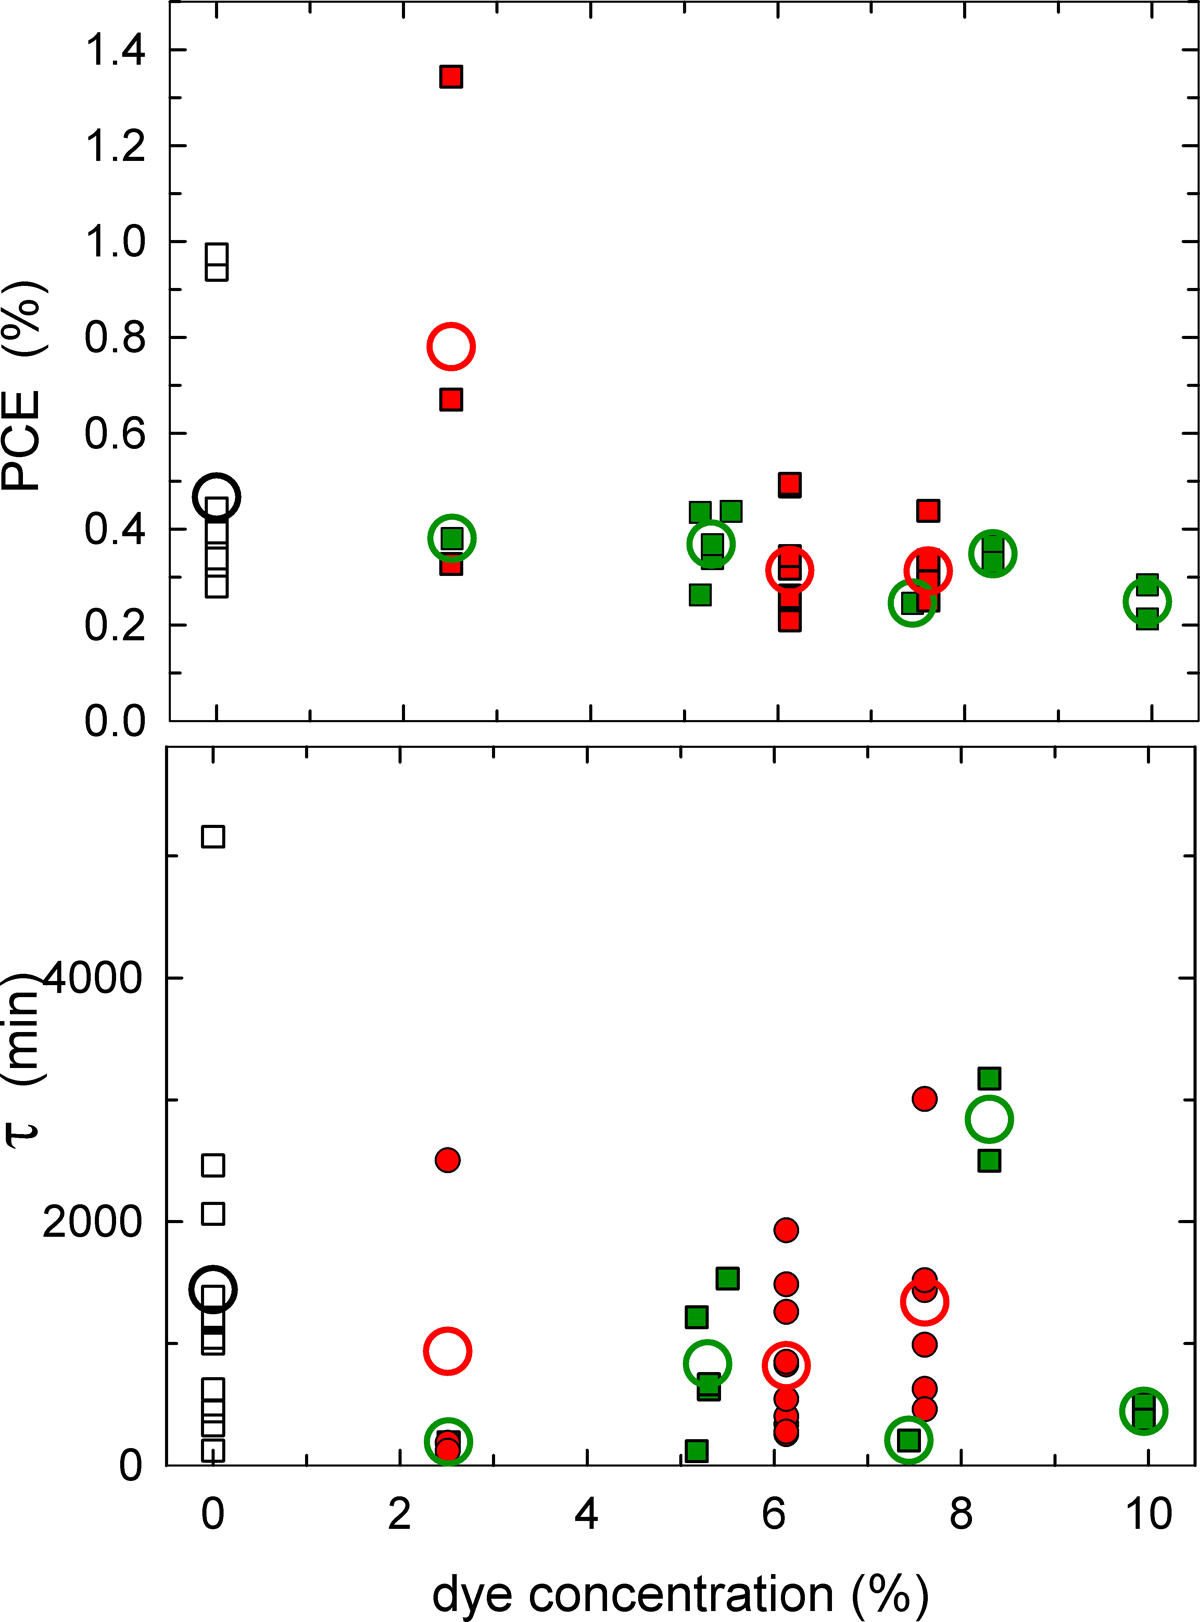
Efficiency and lifetime data from a series of PCBM:P3HT:dye devices. We plot: (top) the initial power conversion efficiency η; and (bottom) the decay time constant τ as a function of dye weight percent with respect to PCBM. The small symbols refer to each sample measured and the large circles show the average value for each dye concentration. Black symbols represent samples without dye whereas the red and green symbols refer to red (DR1) and green (1) dyes respectively.
Current usage metrics show cumulative count of Article Views (full-text article views including HTML views, PDF and ePub downloads, according to the available data) and Abstracts Views on Vision4Press platform.
Data correspond to usage on the plateform after 2015. The current usage metrics is available 48-96 hours after online publication and is updated daily on week days.
Initial download of the metrics may take a while.