Fig. 2
Download original image
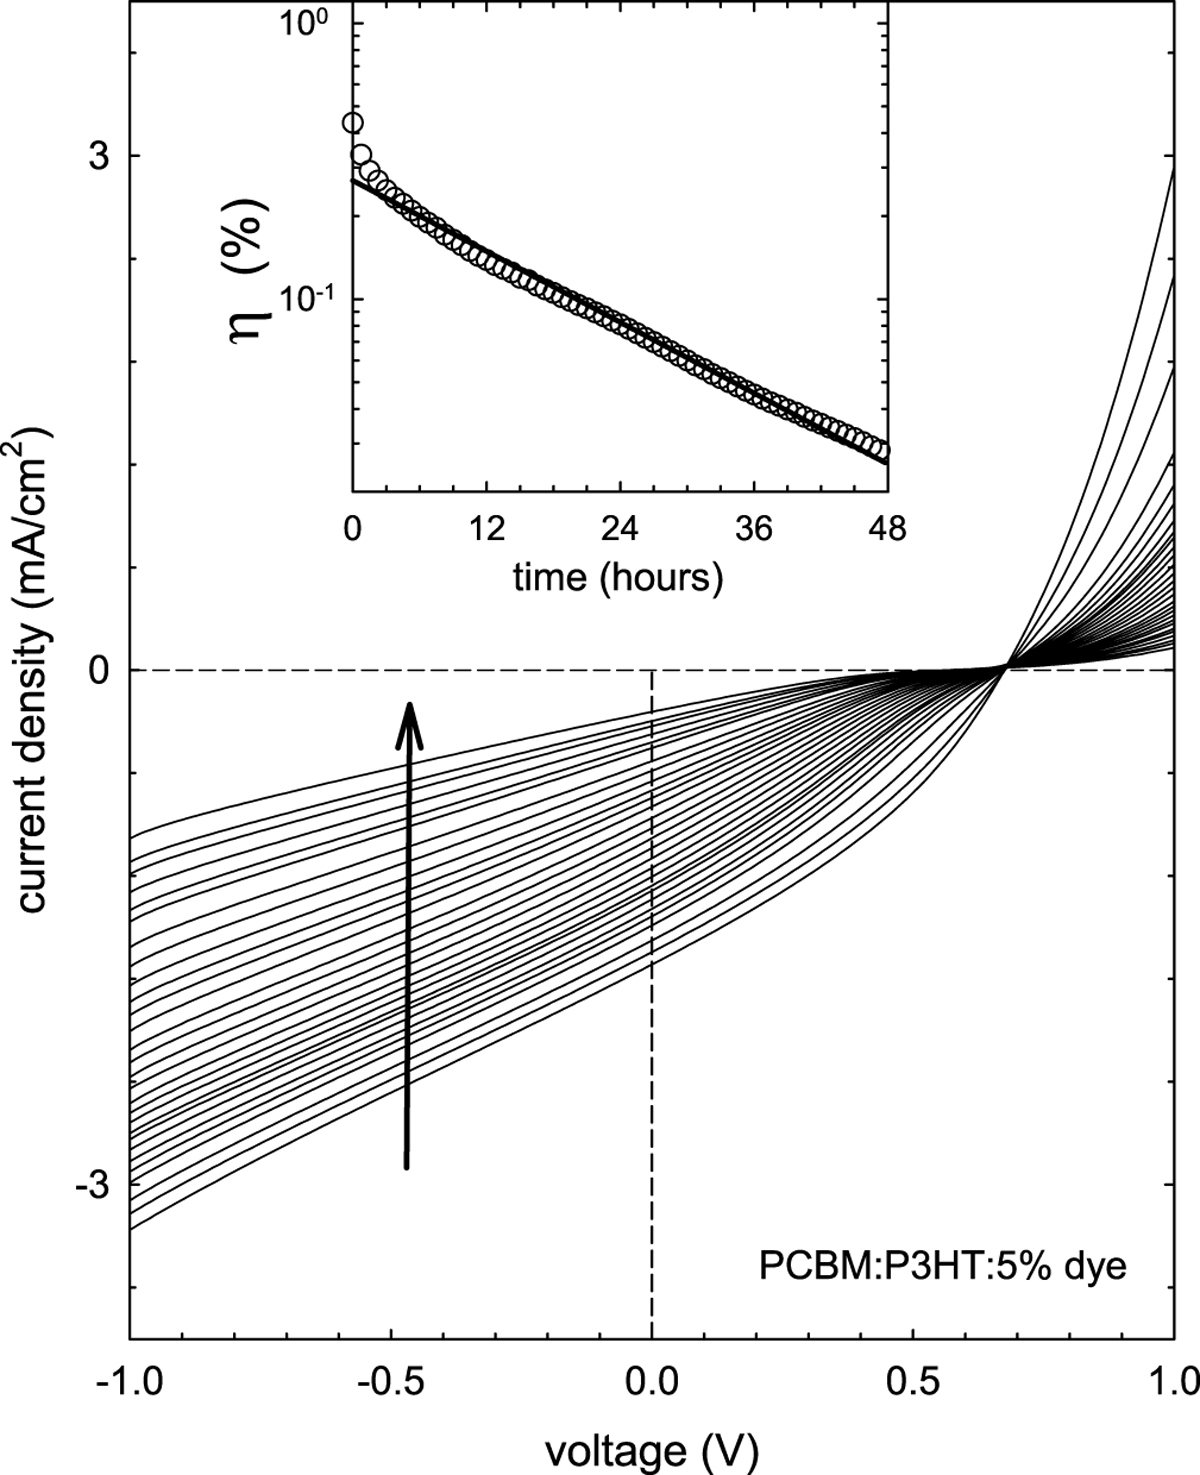
Current-voltage (I–V) curves that exhibit the degradation of a PCBM:P3HT:dye device in ambient conditions. The arrow indicates the progression of time. Inset: the power conversion efficiency of this device in a semilog plot as a function of time. The solid line fit is used to extract the lifetime τ (reciprocal of the slope).
Current usage metrics show cumulative count of Article Views (full-text article views including HTML views, PDF and ePub downloads, according to the available data) and Abstracts Views on Vision4Press platform.
Data correspond to usage on the plateform after 2015. The current usage metrics is available 48-96 hours after online publication and is updated daily on week days.
Initial download of the metrics may take a while.