Open Access
Fig. 5
Download original image
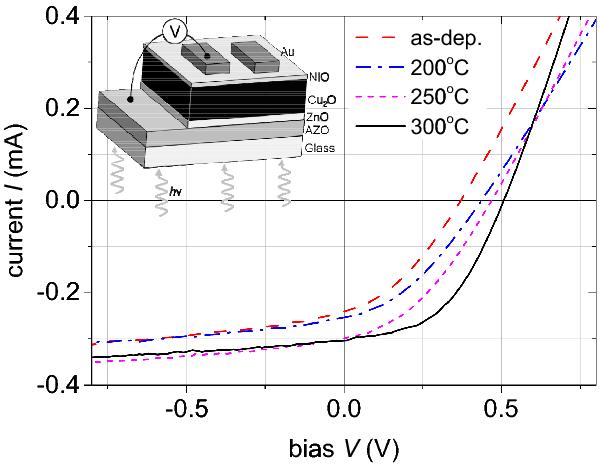
I - V curves measured under simulated solar spectrum (AM1.5G) for a cell of 6.5 mm2 area after being annealed at different temperatures. Inset shows schematic of the solar cell structure.
Current usage metrics show cumulative count of Article Views (full-text article views including HTML views, PDF and ePub downloads, according to the available data) and Abstracts Views on Vision4Press platform.
Data correspond to usage on the plateform after 2015. The current usage metrics is available 48-96 hours after online publication and is updated daily on week days.
Initial download of the metrics may take a while.