Fig. 7
Download original image
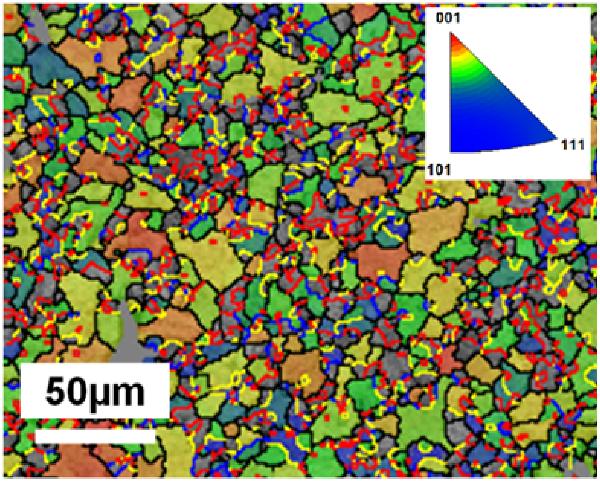
Orientation map deduced from EBSD analysis. The lines shows the grain boundaries (twins: red = Σ3, yellow = Σ9, blue = Σ29, black = randomly orientated). The inverse pole figure in the z-axis in reported on the inset (red color = high density, blue = low density).
Current usage metrics show cumulative count of Article Views (full-text article views including HTML views, PDF and ePub downloads, according to the available data) and Abstracts Views on Vision4Press platform.
Data correspond to usage on the plateform after 2015. The current usage metrics is available 48-96 hours after online publication and is updated daily on week days.
Initial download of the metrics may take a while.