Fig. 2
Download original image
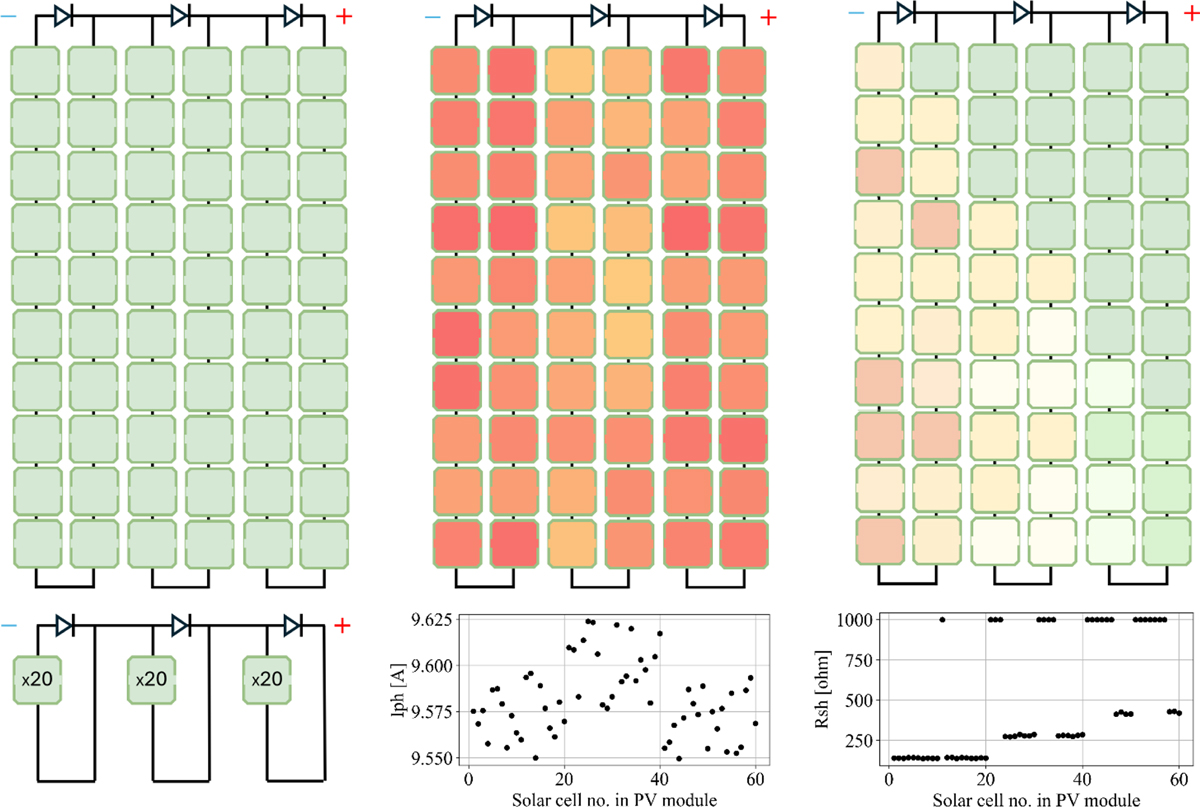
Modeling 60-cell PV modules: healthy PV module (top left) with identical solar cells grouped in each cell-substring (bottom left), PV module with PID-p (top center) and the corresponding IPH values (bottom center) and PV module with PID-s (top right) and the corresponding RSH values (bottom right). Note: the colors of the solar cells qualitatively illustrate degradation levels and do not represent the actual values of the model input parameters.
Current usage metrics show cumulative count of Article Views (full-text article views including HTML views, PDF and ePub downloads, according to the available data) and Abstracts Views on Vision4Press platform.
Data correspond to usage on the plateform after 2015. The current usage metrics is available 48-96 hours after online publication and is updated daily on week days.
Initial download of the metrics may take a while.