Fig. 12
Download original image
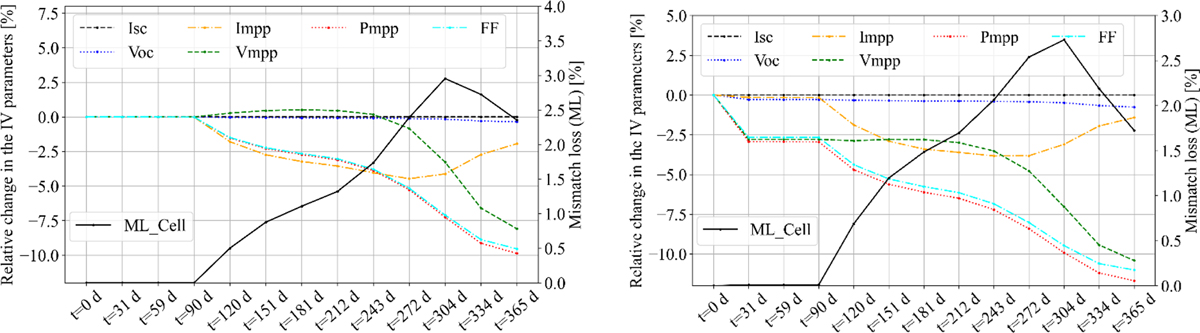
The relative change in the I-V parameters extracted from simulated I-V curves of the PV array (dashed lines) and the mismatch losses in PMAX (solid line) at different PID-s degradation stages, and at STC and NOCT (right).
Current usage metrics show cumulative count of Article Views (full-text article views including HTML views, PDF and ePub downloads, according to the available data) and Abstracts Views on Vision4Press platform.
Data correspond to usage on the plateform after 2015. The current usage metrics is available 48-96 hours after online publication and is updated daily on week days.
Initial download of the metrics may take a while.