Fig. 9
Download original image
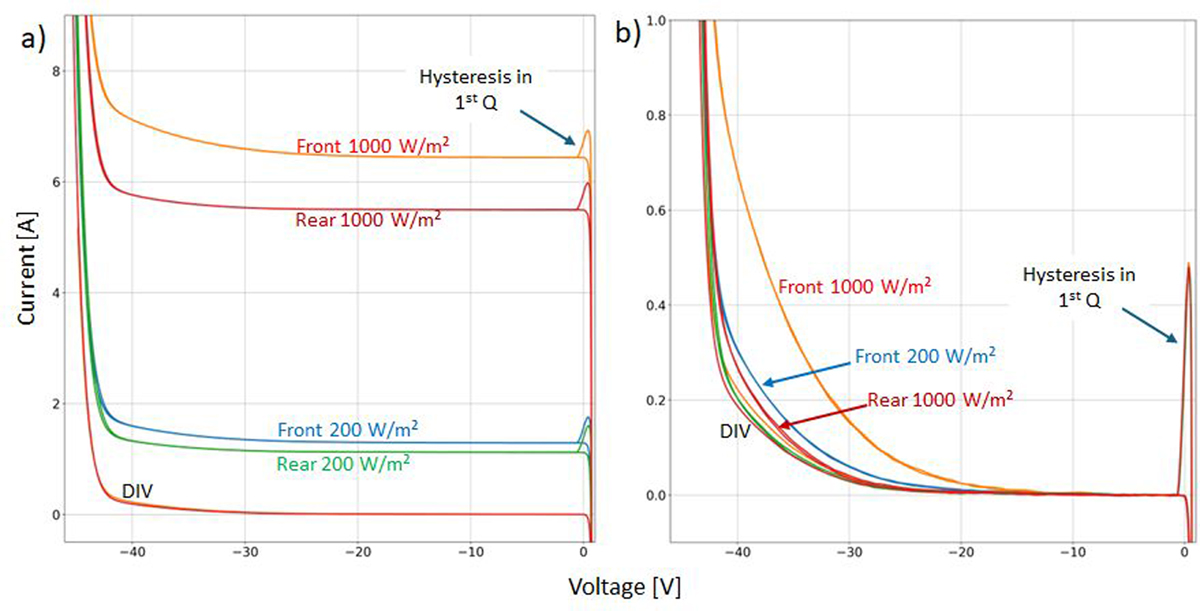
IV-curves taken at 1000W/m2, 200W/m2 and in the dark are shown for the front and rear side of a TOPCon 16 busbar M10 cell in both Isc–> Voc and Voc −> Isc direction. a) The hysteresis in the 1st-quadrant is clearly visible due to the long IV-curve sweep required to measure to breakdown (appr. 85ms). There is no indication of a hysteresis effect at reverse breakdown as curves lay directly over each other. b) Same IV-curves but always moved by Isc of correlated intensity. On the front side a low irradiance dependence is visible at voltage above 20V.
Current usage metrics show cumulative count of Article Views (full-text article views including HTML views, PDF and ePub downloads, according to the available data) and Abstracts Views on Vision4Press platform.
Data correspond to usage on the plateform after 2015. The current usage metrics is available 48-96 hours after online publication and is updated daily on week days.
Initial download of the metrics may take a while.