Fig. 2
Download original image
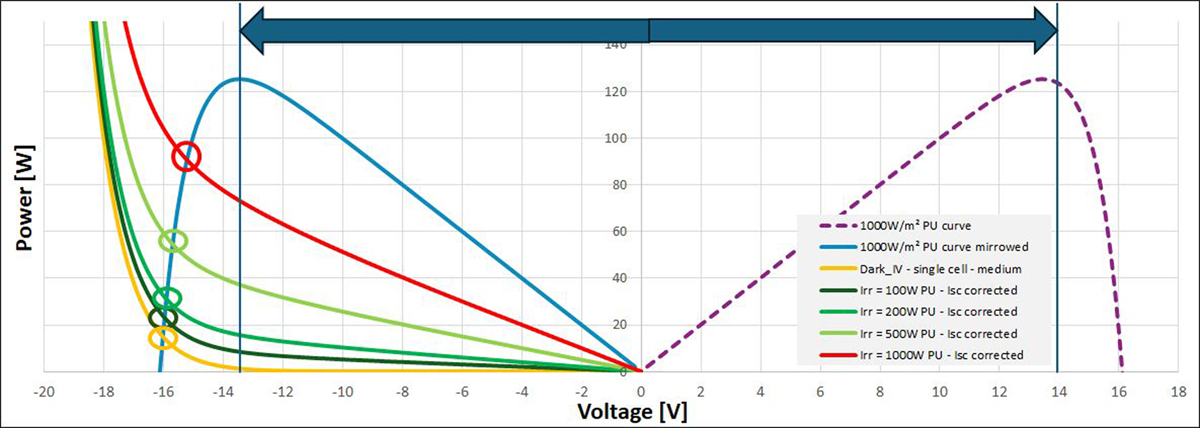
Schematic PU curve for an unshaded string on the right side and mirrored to the left (to show crossing points). Colored from Orange (same as “medium” in Fig. 1) of a dark PU to red a partially shaded cell with different shading ratios. The intersections represent maximum power transfer between unshaded power generating cells and power dissipating shaded cell.
Current usage metrics show cumulative count of Article Views (full-text article views including HTML views, PDF and ePub downloads, according to the available data) and Abstracts Views on Vision4Press platform.
Data correspond to usage on the plateform after 2015. The current usage metrics is available 48-96 hours after online publication and is updated daily on week days.
Initial download of the metrics may take a while.