Fig. 15
Download original image
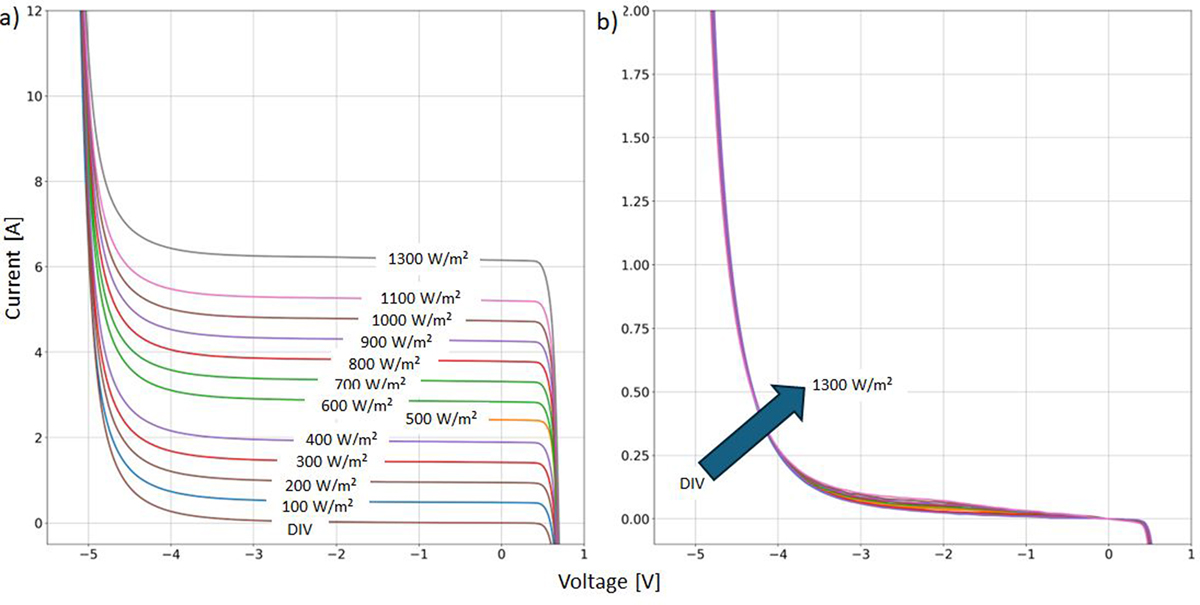
a) IV-curves taken at 1300W/m2 and from 1100W/m2 to dark IV in 100W/m2 steps of a IBC mono crystalline half-cut cell (voltage scaled by number of cells). b) Same IV-curves but always moved by Isc of correlated intensity. Reverse-breakdown occurs at around −4.5V as known for that solar cell type. There is basically no irradiance dependence visible. The arrow is same length compared to Figures 10, 11, and 14.
Current usage metrics show cumulative count of Article Views (full-text article views including HTML views, PDF and ePub downloads, according to the available data) and Abstracts Views on Vision4Press platform.
Data correspond to usage on the plateform after 2015. The current usage metrics is available 48-96 hours after online publication and is updated daily on week days.
Initial download of the metrics may take a while.