Fig. 12
Download original image
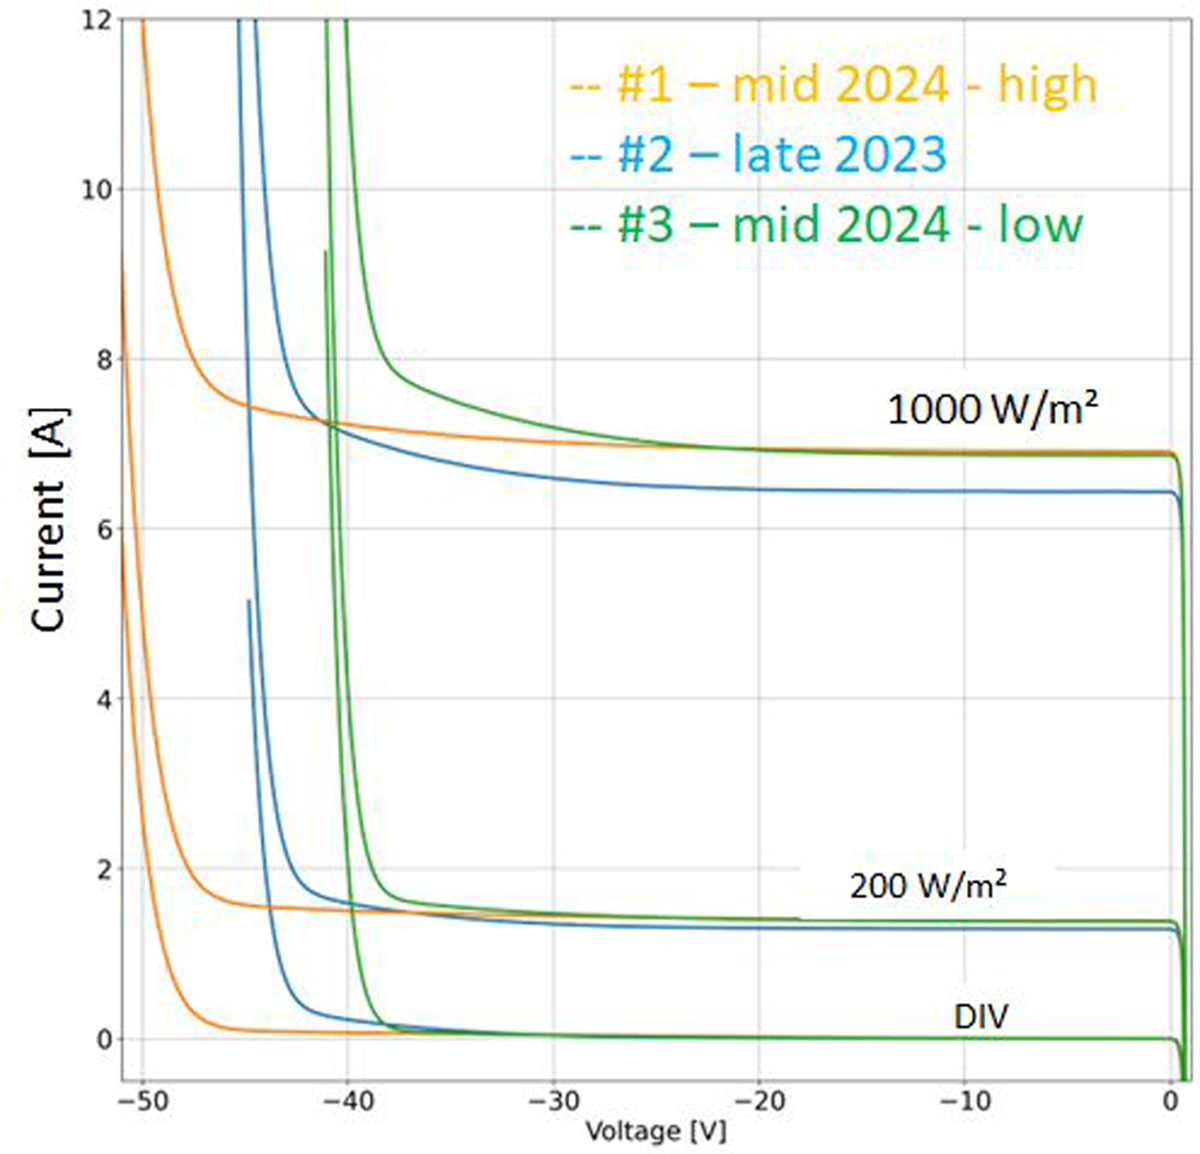
a) IV-curves taken at 1000W/m2, 200W/m2 and dark IV for three different 16 busbar TOPCon G12 mono-crystalline half-cut cell. Two (#1 and #3) are from mid 2024 and also used in Figure 11, and one from late 2023 (#2) from Figure 10. A shift from around −48V to “only”-39V is clearly visible, showing the influence of manufacturing process. The lower current for #2 is mainly a result of different sample design with higher optical losses.
Current usage metrics show cumulative count of Article Views (full-text article views including HTML views, PDF and ePub downloads, according to the available data) and Abstracts Views on Vision4Press platform.
Data correspond to usage on the plateform after 2015. The current usage metrics is available 48-96 hours after online publication and is updated daily on week days.
Initial download of the metrics may take a while.