Fig. 6
Download original image
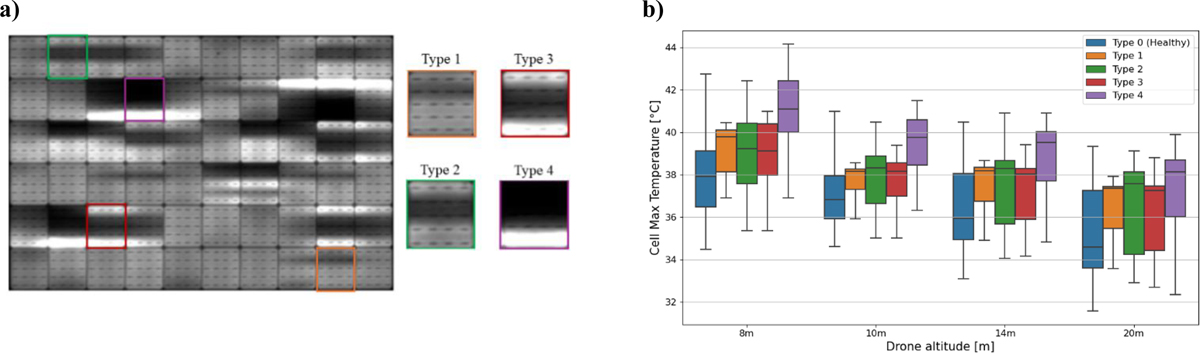
a) EL image of a fielded module with damaged cell interconnects. Highlighted cells show an example of a cell interconnect failure Type 1 (orange), Type 2 (green), Type 3 (Red) and Type 4 (Purple). b) Boxplot showing the maximum cell temperature trend in drone altitude and cell disconnection severities compared to healthy cells. Irradiance of the inspection >800 W/m2.
Current usage metrics show cumulative count of Article Views (full-text article views including HTML views, PDF and ePub downloads, according to the available data) and Abstracts Views on Vision4Press platform.
Data correspond to usage on the plateform after 2015. The current usage metrics is available 48-96 hours after online publication and is updated daily on week days.
Initial download of the metrics may take a while.