Fig. 11
Download original image
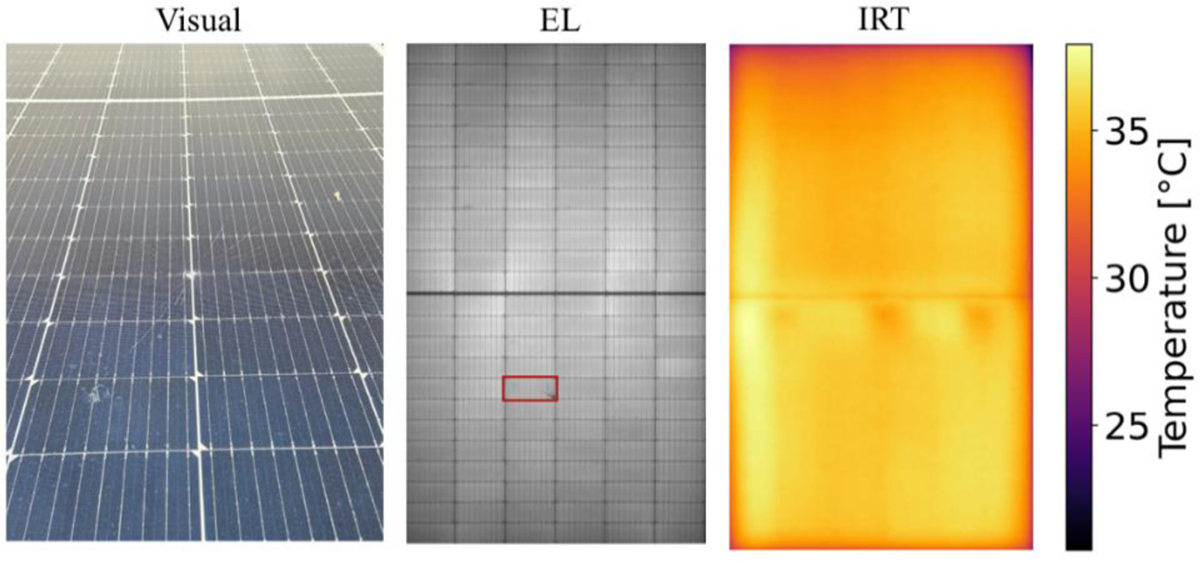
Visual image, EL image and IRT image of one of the modules with glass cracks, imaged at 800 W/m2 and 8 m drone altitude (<1 cm/pixel moduel spatial resolution). The red square in the EL image indicates the point of impact on stress test that created a small cell crack.
Current usage metrics show cumulative count of Article Views (full-text article views including HTML views, PDF and ePub downloads, according to the available data) and Abstracts Views on Vision4Press platform.
Data correspond to usage on the plateform after 2015. The current usage metrics is available 48-96 hours after online publication and is updated daily on week days.
Initial download of the metrics may take a while.