Fig. 6
Download original image
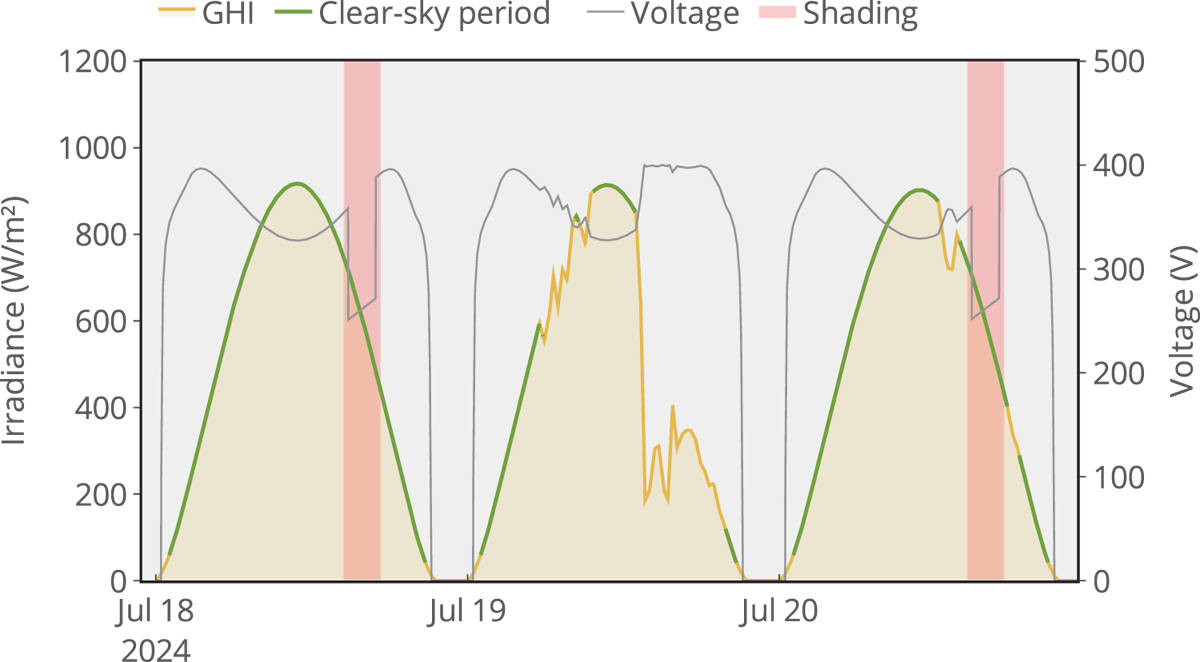
Example of clear-sky filtering for PV fault diagnosis. The GHI (yellow) is plotted alongside a PV system's voltage (grey). The output of the Refined CSD Model is shown as the highlighted clear-sky period (green). During two clear-sky intervals, sharp, anomalous dips in voltage are observed which are not correlated with irradiance, indicating a system fault due to partial shading with bypass diode activation.
Current usage metrics show cumulative count of Article Views (full-text article views including HTML views, PDF and ePub downloads, according to the available data) and Abstracts Views on Vision4Press platform.
Data correspond to usage on the plateform after 2015. The current usage metrics is available 48-96 hours after online publication and is updated daily on week days.
Initial download of the metrics may take a while.