Fig. 5
Download original image
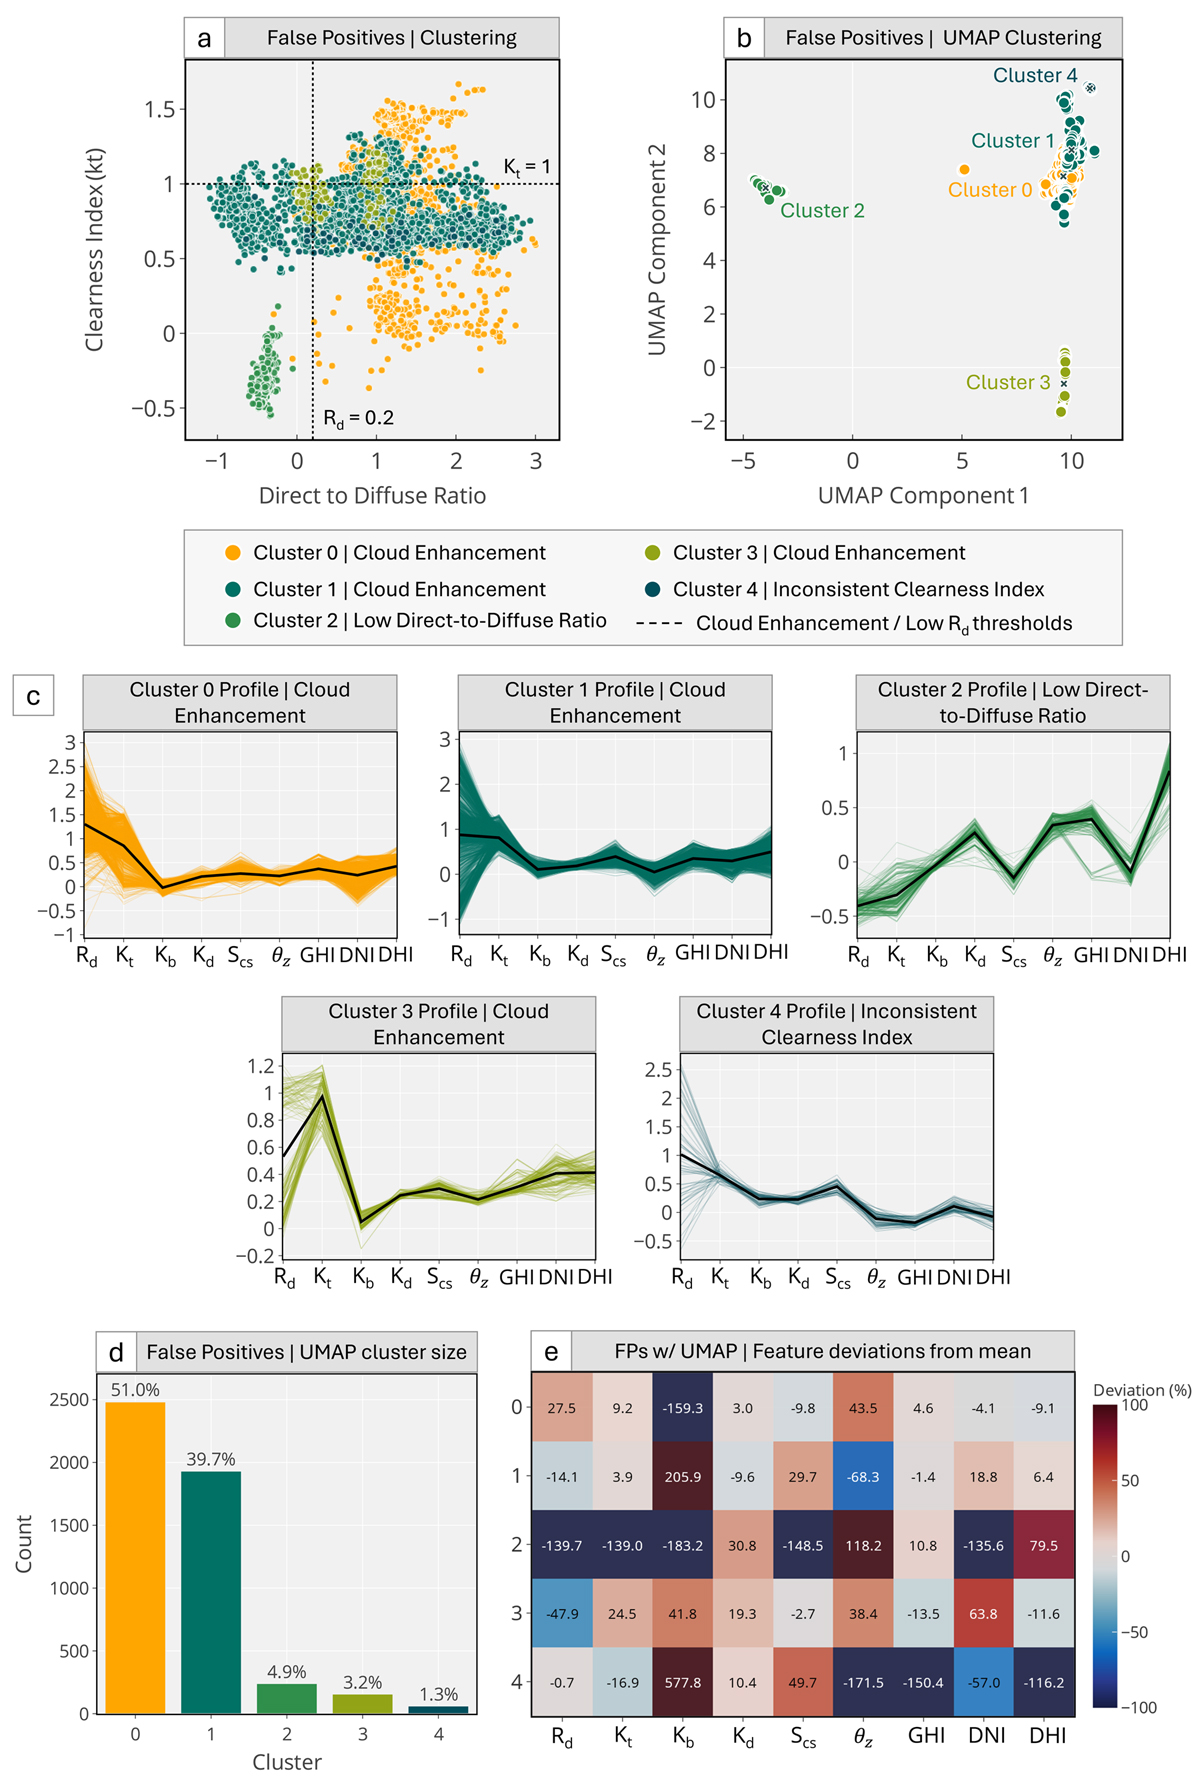
Comprehensive analysis of False Positive (FP) clusters from the Advanced CSD Model, derived from clustering misclassification SHAP values. (a) Distribution of FPs in the feature space of Clearness Index (kt) and Direct to Diffuse Ratio (Rd), with reference lines for cloud enhancement and low-ratio conditions. (b) UMAP projection of the FP SHAP values, which demonstrates a clear separation of the errors into distinct clusters. (c) Parallel coordinate plots showing the unique, normalized feature profile for each identified cluster. (d) The relative size of each FP cluster, identifying 'Cloud Enhancement' as the dominant failure mode. (e) Heatmap quantifying the mean percentage deviation of key features for each cluster from the global FP average, providing a quantitative basis for the patterns seen in (c).
Current usage metrics show cumulative count of Article Views (full-text article views including HTML views, PDF and ePub downloads, according to the available data) and Abstracts Views on Vision4Press platform.
Data correspond to usage on the plateform after 2015. The current usage metrics is available 48-96 hours after online publication and is updated daily on week days.
Initial download of the metrics may take a while.