Fig. 1
Download original image
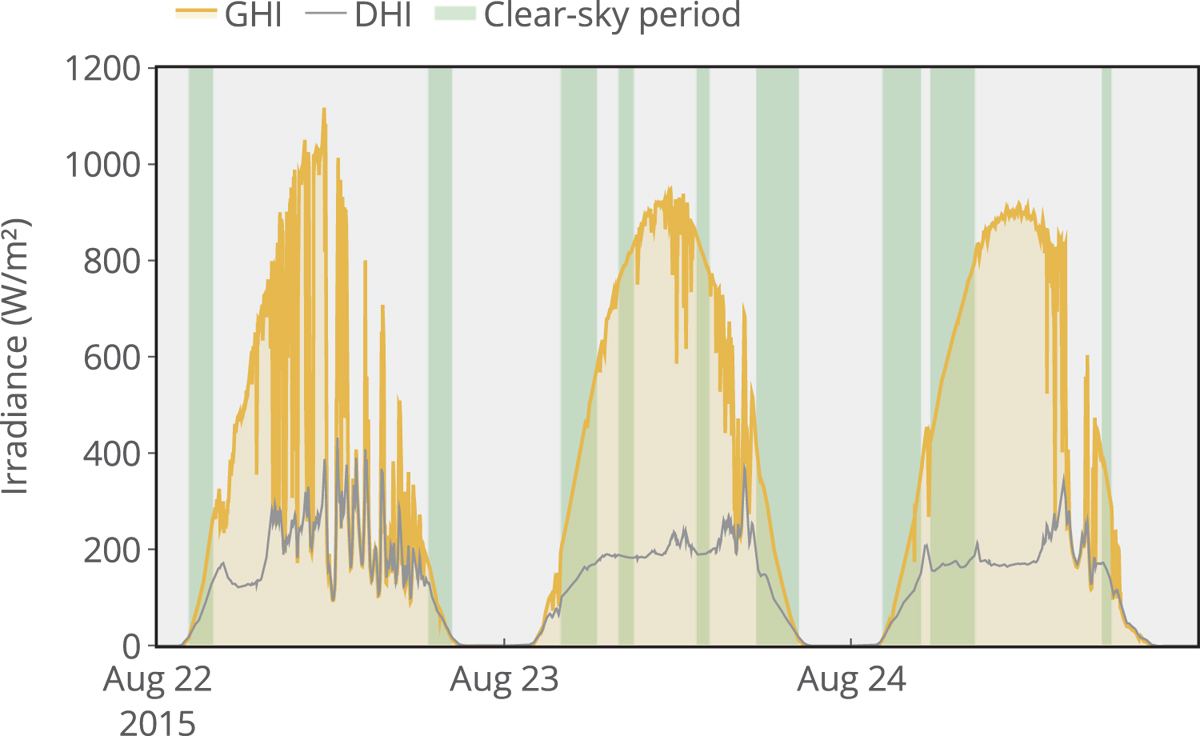
Example of the hand-labelled clear-sky dataset. The plot displays 1 min time series of Global Horizontal Irradiance (GHI) and Diffuse Horizontal Irradiance (DHI) to visually illustrate the difference between clear periods (smooth GHI, low DHI) and cloudy conditions. The source dataset, from a fixed-tilt PV system in Golden, CO, USA [6], also provides the Direct Normal Irradiance (DNI) and Plane-of-Array (POA) irradiance used in this study. The clear-sky periods, highlighted in green, were manually labelled based on comparisons to a clear-sky model and stable temporal variability.
Current usage metrics show cumulative count of Article Views (full-text article views including HTML views, PDF and ePub downloads, according to the available data) and Abstracts Views on Vision4Press platform.
Data correspond to usage on the plateform after 2015. The current usage metrics is available 48-96 hours after online publication and is updated daily on week days.
Initial download of the metrics may take a while.