Fig. 7
Download original image
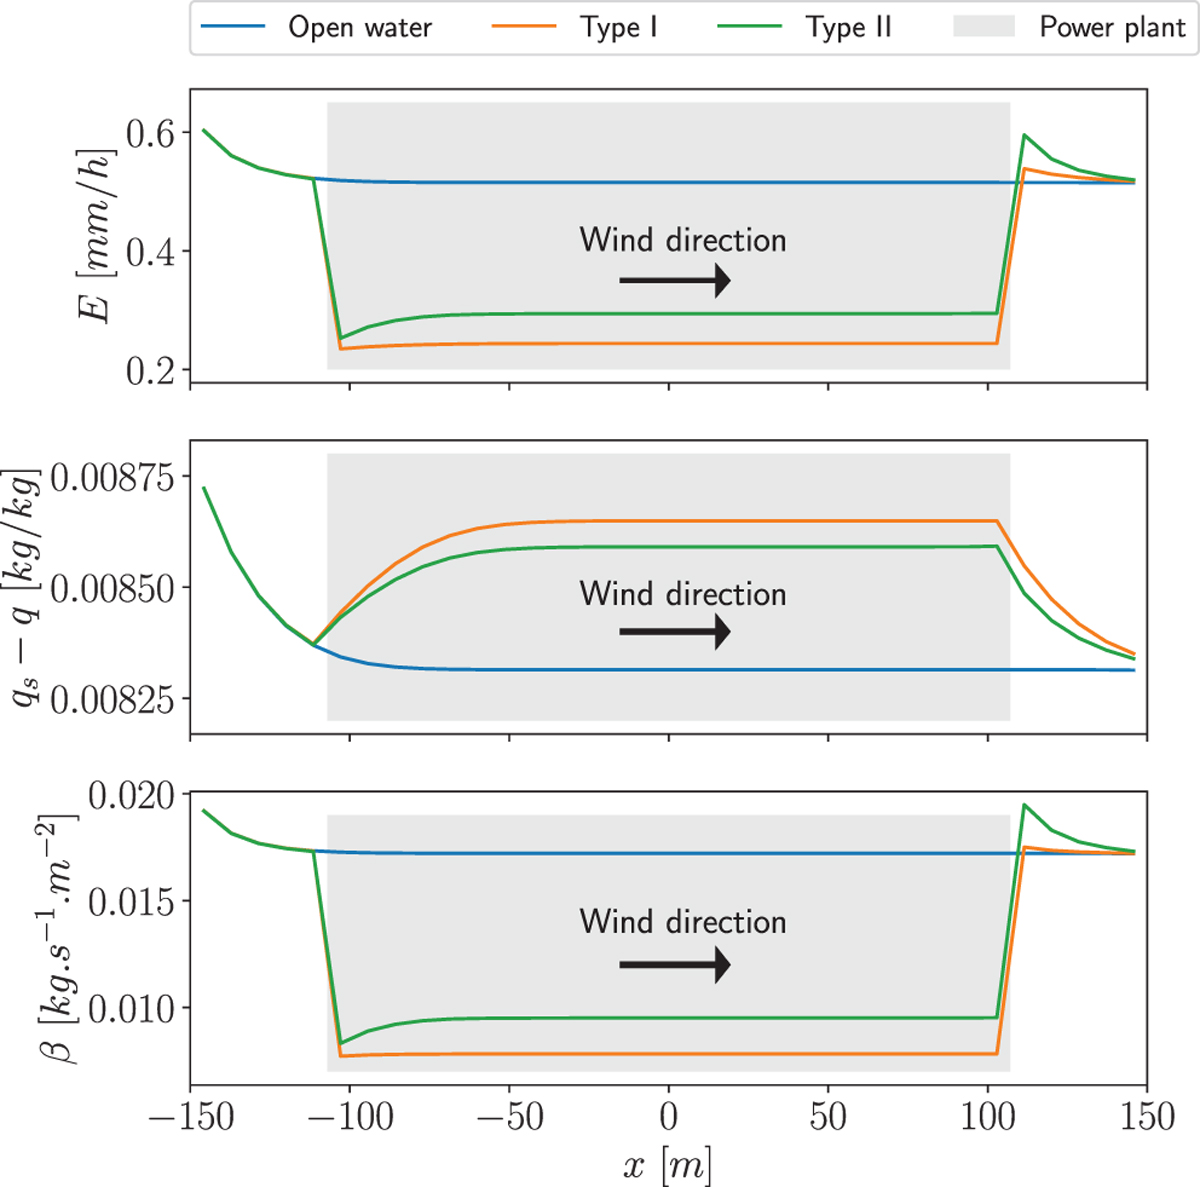
Evaporation rate (E), specific humidity difference (qs‒q) and mass transfer coefficient (β) profiles along the water reservoir. Grayed area corresponds the size of the FPV plant.
Current usage metrics show cumulative count of Article Views (full-text article views including HTML views, PDF and ePub downloads, according to the available data) and Abstracts Views on Vision4Press platform.
Data correspond to usage on the plateform after 2015. The current usage metrics is available 48-96 hours after online publication and is updated daily on week days.
Initial download of the metrics may take a while.