Fig. 3
Download original image
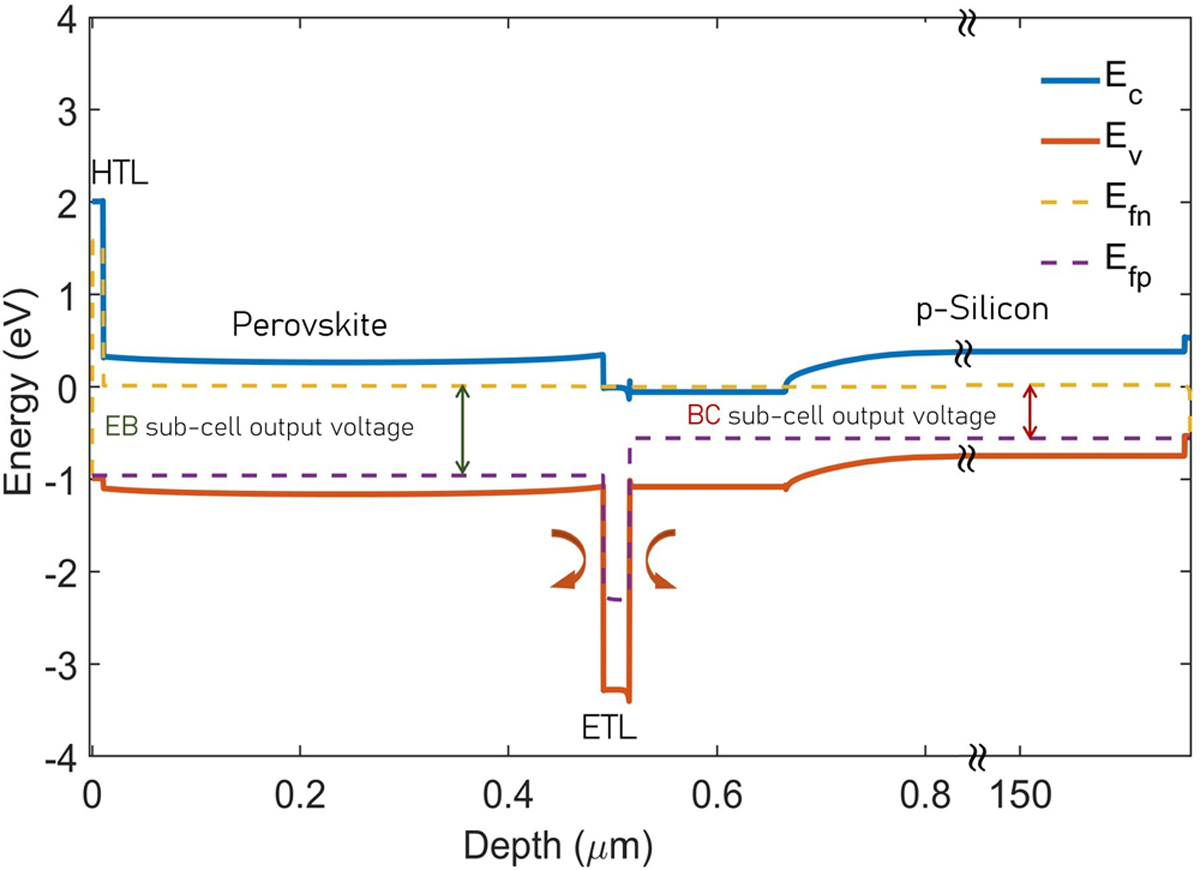
Energy band diagram of the p-n-p 3T-HBT case study (Fig. 2a) with each junction biased at maximum power point. The dashed yellow and pink lines are the electron and hole quasi-Fermi levels, respectively.
Current usage metrics show cumulative count of Article Views (full-text article views including HTML views, PDF and ePub downloads, according to the available data) and Abstracts Views on Vision4Press platform.
Data correspond to usage on the plateform after 2015. The current usage metrics is available 48-96 hours after online publication and is updated daily on week days.
Initial download of the metrics may take a while.